Complexity Trends
Complexity Trends are used to get more information around our Hotspots.
Once we’ve identified a number of Hotspots, we need to understand how they evolve; Are they Hotspots because they get more and more complicated over time? Or is it more a question of minor changes to a stable code structure? Complexity Trends help you answer those questions.
Complexity Trends are calculated from the Evolution of a Hotspot
A Complexity Trend is calculated by fetching each historic version of a Hotspot and calculating the code complexity of those historic versions. The algorithm allows us to plot a trend over time as illustrated in Fig. 57.
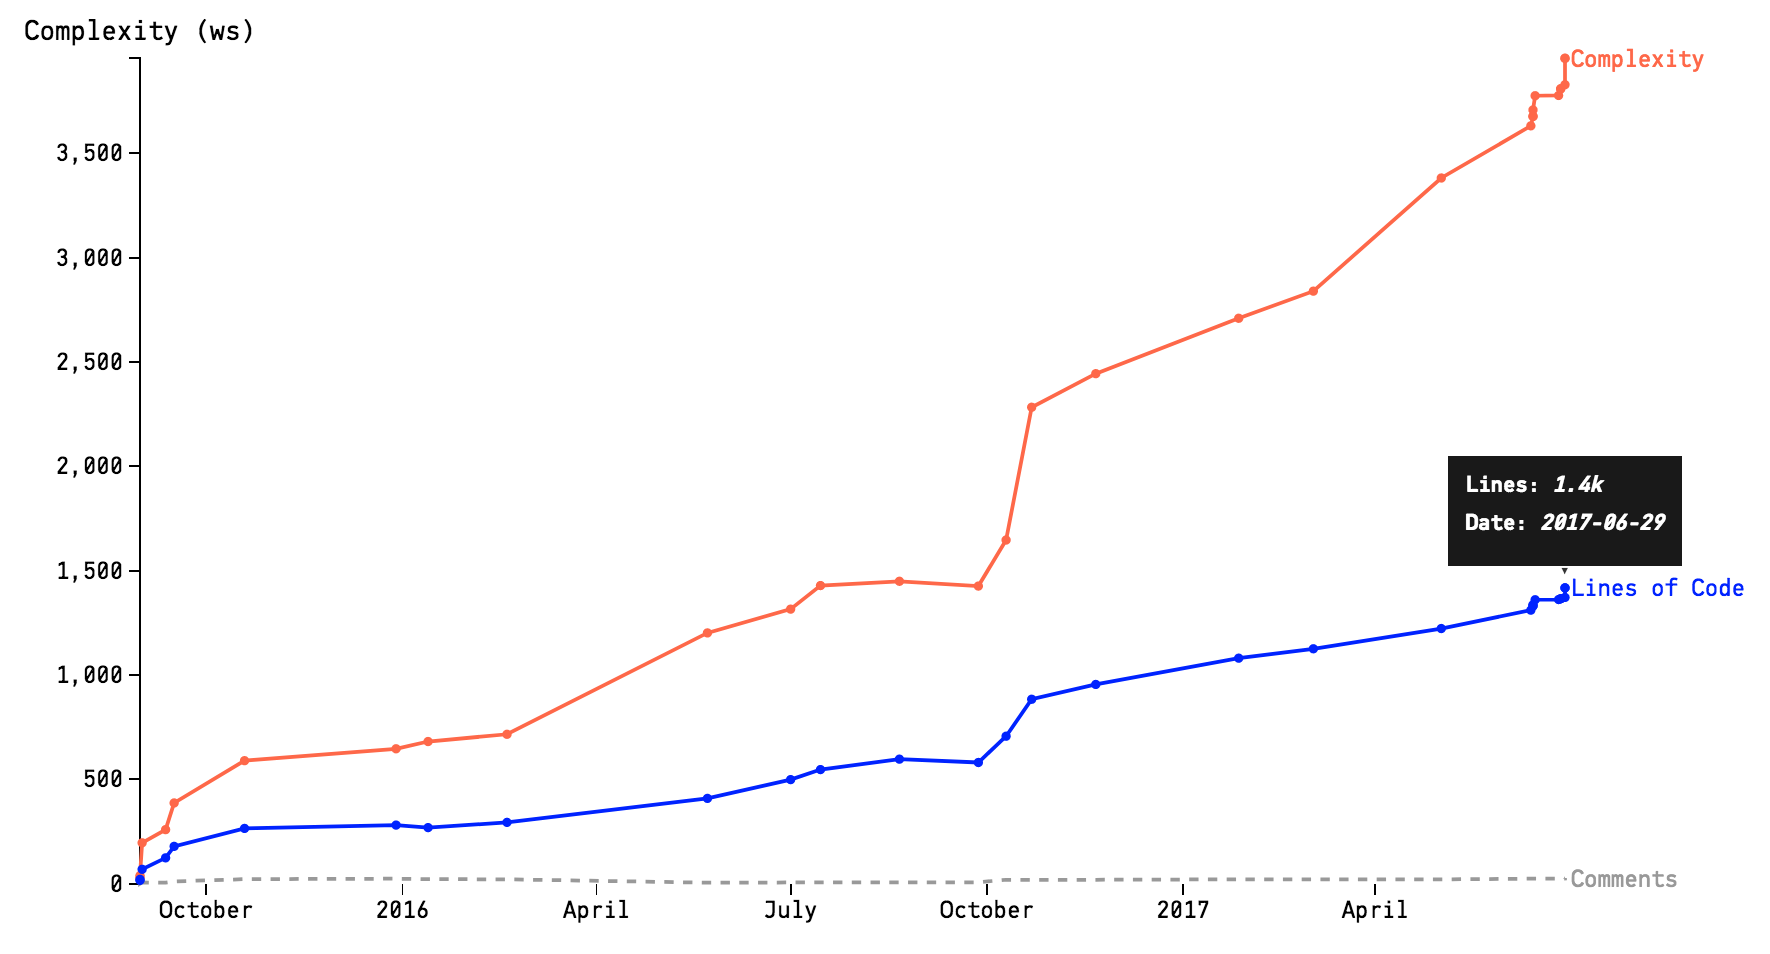
Fig. 57 A complexity trend sample.
The picture above shows the complexity trend of single hotspot, starting in mid 2015 and showing its evolution over the next year. It paints a worrisome picture since the complexity has started to grow rapidly.
Worse, as evident by the Complexity/Lines of Code ratio shown in Fig. 58, the complexity grows non-linear to the amount of new code, which indicates that the code in the hotspot gets harder and harder to understand. You also see that the accumulation of complexity isn’t followed by any increase in descriptive comments. So if you ever needed ammunition to motivate a refactoring, well, it doesn’t get more evident than cases like this; This file looks more and more like a true maintenance problem.
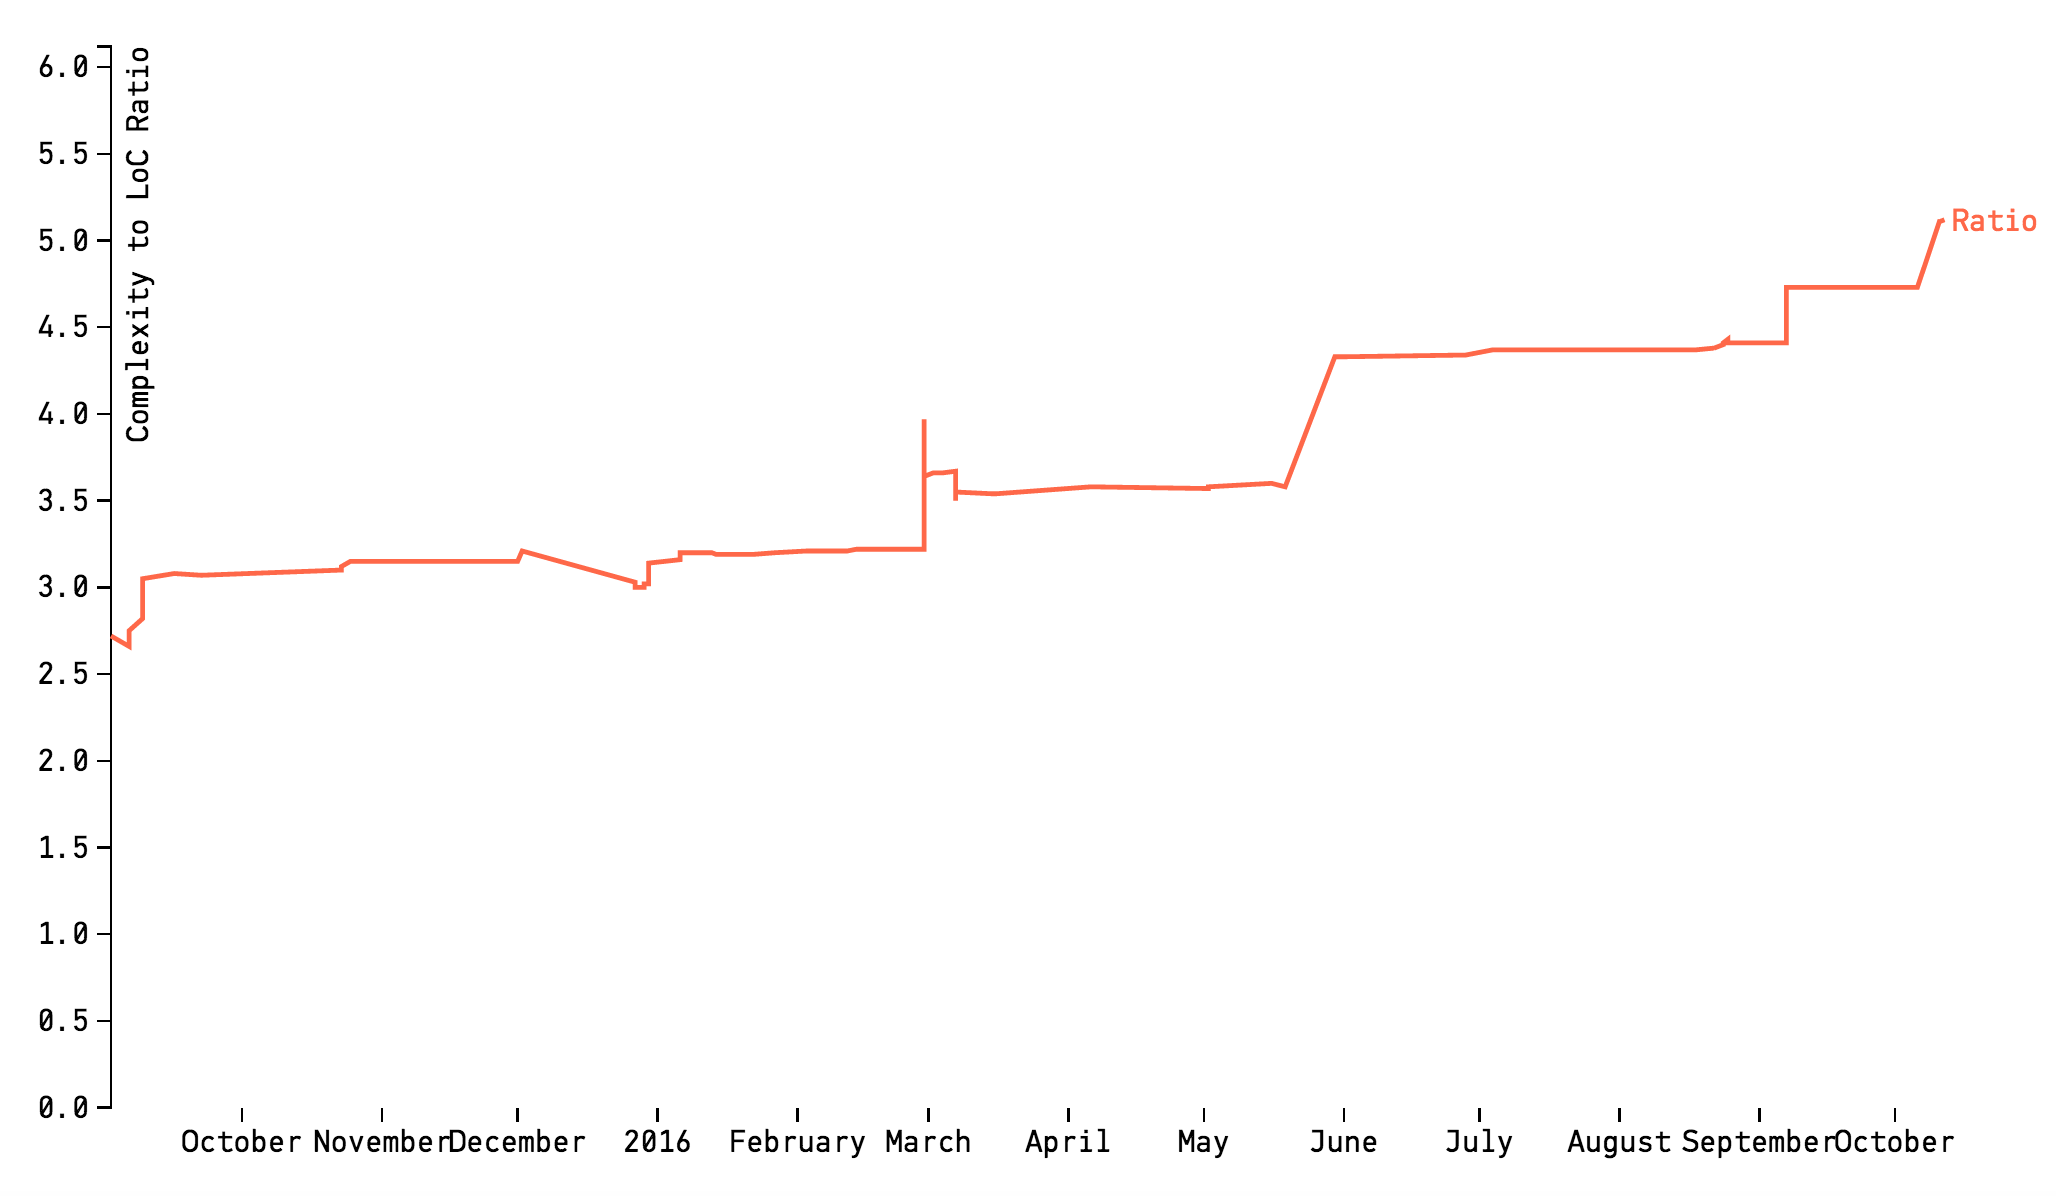
Fig. 58 The ratio between complexity and lines of code accumulation.
We’ll soon explain how we measure complexity. But let’s cover the most important aspect of Complexity Trends first. Let’s understand the kind of patterns we can expect.
Know your Complexity Trend Patterns
When interpreting complexity trends, the absolute numbers are the least interesting part. You want to focus on the overall shape and pattern first. Fig. 59 illustrates the shapes you’re most likely to find in a codebase.

Fig. 59 Complexity trend patterns you might find in a codebase.
Let’s have a more detailed look at what the three typical patterns you see above actually mean.
The Pattern for Deteriorating Code
The pattern to the left, Deteriorating Code, is a sign that the Hotspot needs refactoring. The code has kept accumulating complexity. Code does that in either (or both) of the following ways:
Code Accumulates Responsibilities: A common case is that new features and requirements are squeezed into an existing class or module. Over time, the unit’s cohesion drops significantly. The consequence of that for our ability to maintain the code is severe; We will now have to change the same unit of code for many different reasons. Not only does it put us at risk for unexpected feature interactions and defects. It’s also harder to re-use the code and to modify it due to the excess cognitive load we face in a module with more or less related functionality.
Constant Modification to a Stable Structure: Another common reason that code become hotspots is because of a low-quality implementation. We constantly have to re-visit the code, add an if-statement to fix some corner case and perhaps introduce that missing else-branch. Soon, the code becomes a maintenance nightmare of mythical proportions (you know, the kind of code you use to scare new recruits).
Complexity Trends let you detect these two potential problems early. Once you’ve found them, you need to refactor the code. And Complexity Trends are useful to track your improvements too. Let’s see how.
Track Improvements with Complexity Trends
Have one more look at the picture above. You see the second pattern, “Refactoring”? A downward slope in a complexity trend is a good sign. It either means that your code gets simpler (perhaps as those nasty if-else-chains get refactored into a polymorphic solution) or that there’s less code because you extract unrelated parts into other modules.
Now, please pat yourself on the back if you have the Refactoring trend in your hotspots - it’s great! But do keep exploring the complexity trends; What often happens is that we spend an awful amount of time and money on improving something, fail to address the root cause, and soon the complexity slips back in. Fig. 60 illustrates one such scary case.
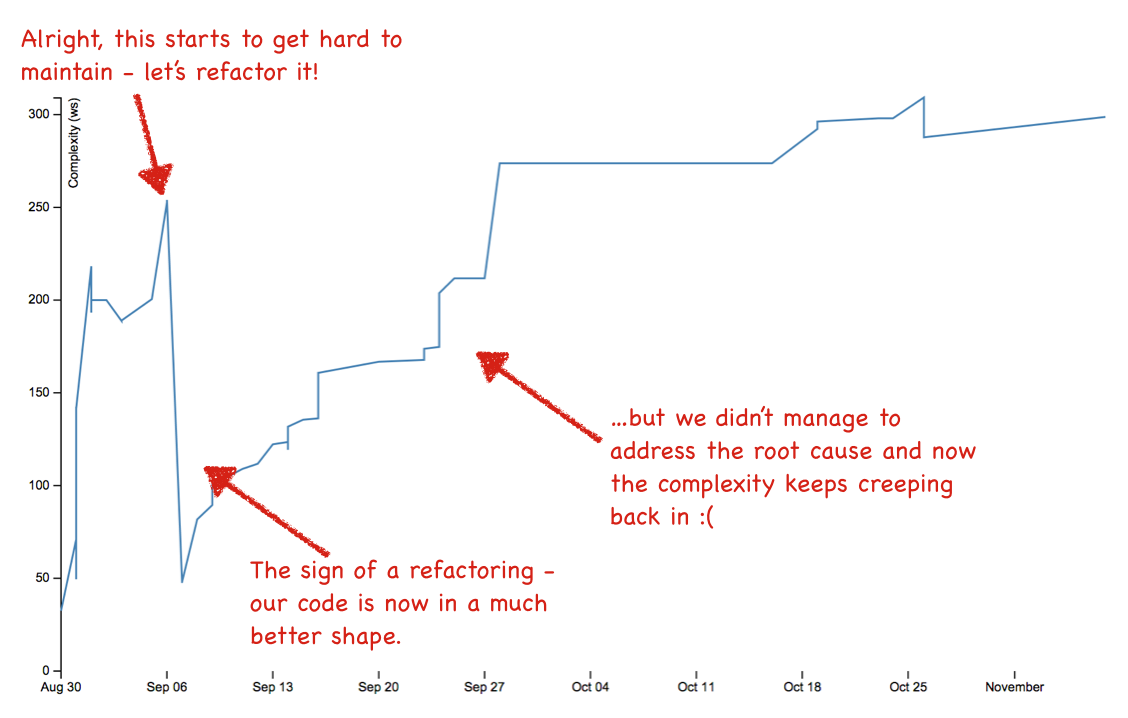
Fig. 60 Example on failed refactoring.
You might think this a special case. But let me assure you - during the work on these analysis techniques we analysed hundred of codebases and we found this pattern more often than not. So please, make it a habit to supervise your complexity trend.
Stable Trends May Indicate Problems Too
The final pattern that I want us to discuss is “Only minor modifications”. You see an example on that in Fig. 61.
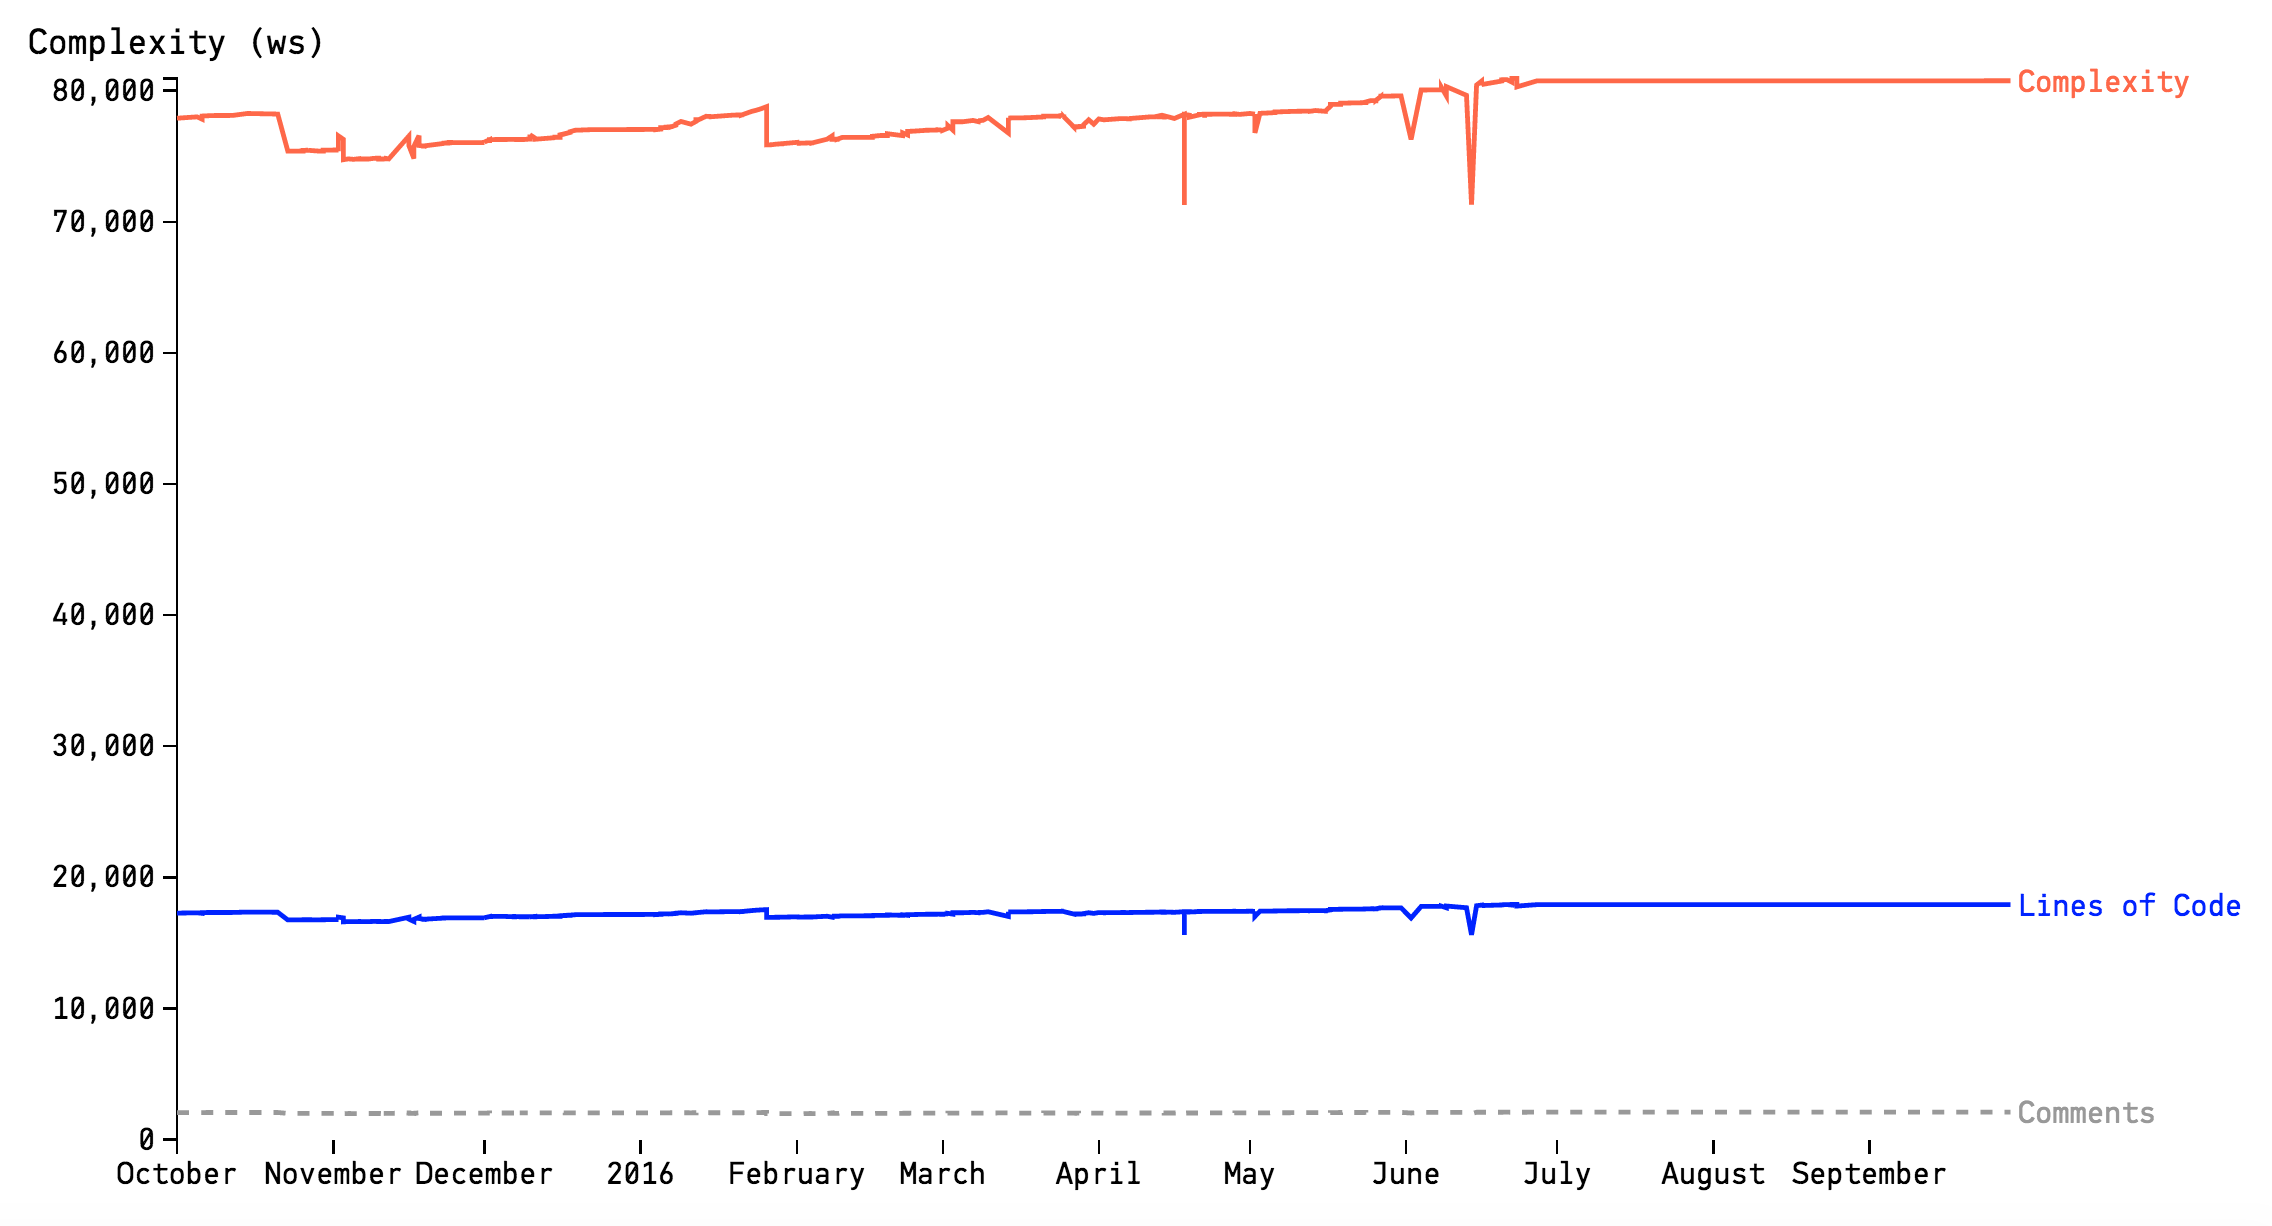
Fig. 61 Minor modifications example.
“Minor modifications” - doesn’t that sound good? Well, have to to put it into context; The reason you explore a Complexity Trend is because the file is a Hotspot. If a file has become a Hotspot, it means we’re making a lot of modifications to it. That’s a warning sign.
Even if the code itself doesn’t become worse of time, as evident by the trend, all those small changes are still bound to be expensive and, potentially, high risk. The key to efficient software maintenance is the opposite: you want to stabilize as much of your codebase as you can in terms of development. If a piece of code keeps changing, no matter how small those changes are, it’s a sign that either the problem domain isn’t well understood or the code fails to model it properly.
Taken together, the “minor modifications” pattern in a Hotspot is a sign that you should try to identify the kinds of modifications you do and try to encapsulate them. This step often involves extracting small, cohesive modules from the Hotspot. The X-Ray feature in CodeScene (see X-Ray) can help you with that by showing you when and where you should focus your efforts.
Get Deeper Insights with Descriptive Statistics
The Complexity Trend view presents three additional charts with descriptive statistics:
Max value: This is the maximum complexity value of a single line of code over time. This graph lets you identify pockets of complexity that need refactoring.
Median value: The median is the complexity value that separates the higher half of values from the lower half. An increase in median is a sign that your code doesn’t just grow in terms of new lines; Rather, it’s a sign that the existing code becomes more complicated.
Standard Deviation: A standard deviation tells you how much the complexity of individual lines vary. The lower the standard variation figure, the more alike the lines of code in your program (probably a good sign).
The descriptive statistics require some training to interpret. But as a rule of thumb: if any trend increases, that’s a bad sign.
What’s “Complexity” anyway?
Alright, we said that Complexity Trends calculate the complexity of historic versions of our Hotspots. So what kind of metric do we use for complexity?
The software industry has several well-known metric. You might have heard about Cyclomatic Complexity or Halstead’s volume measurement. These are just two examples. What all complexity metrics have in common, however, are that they are pretty bad at predicting complexity!
So we’ll use a less known metric, but one that has been shown to correlate well with the more popular metrics. We’ll use indentation-based complexity as illustrated in Fig. 62
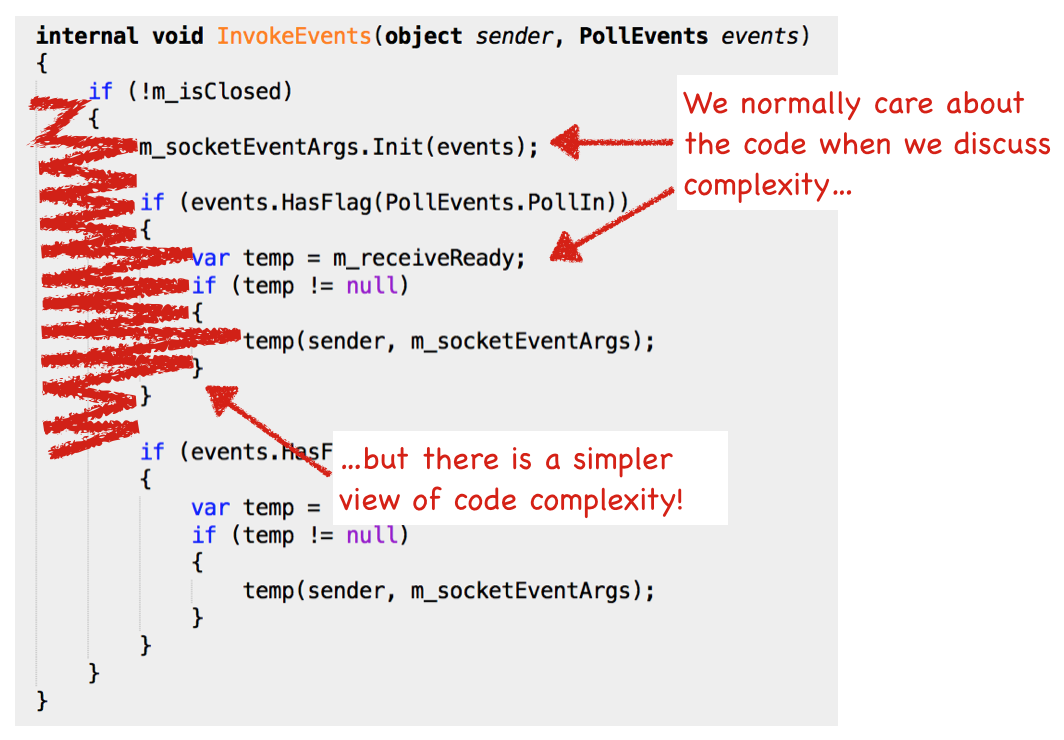
Fig. 62 Explaining whitespace complexity.
Virtually all programming languages use whitespace as indentation to improve readability. In fact, if you look at some code, any code, you’ll see that there’s a strong correlation between your indentations and the code’s branches and loops. Our indentation-based metric calculates the number of indentations (tabs are translated to spaces) with comments and blank lines stripped away.
Indentation-based complexity gives us a number of advantages:
It’s language-neutral, which means you get the same metric for Java, JavaScript, C++, Clojure, etc. This is important in today’s polyglot codebases.
It’s fast to calculate, which means you don’t have to wait half a day to get your analysis results.
Know the Limitations of Indentation-Based Complexity
Of course, there’s no such thing as a perfect complexity metric. Indentation-based complexity has a number of pitfalls and possible biases. Let’s discuss them so that you can keep an eye at them as you interpret the trends in your own code:
Sensitive to layout changes: If you change your indentation style midway through a project, you run the risk of getting biased results. In that case you need to know at what date you made that change and use that when interpreting the results.
Sensitive to individual differences in style: Let’s face it - you want a consistent style within the same module. Inconsistent indentation styles makes it harder to manually scan the code. So please settle on a shared style.
Does not understand complex language constructs: There are certain language constructs that indentation-based complexity will treat as simple although the opposite may hold true. Examples include list compressions and their relatives like the stream API in Java 8 or LINQ in .NET. On the other hand, it’s common to add line breaks and indent those constructs as well.
Alright, we’re through this guide on Complexity Trends and you’re ready to explore the patterns in your own codebase. Just remember that, like all models of complex processes, Complexity Trends are an heuristic - not an absolute truth. They still need your expertise and knowledge about the codebase’s context to interpret them.