From Code to Delivery: the 4 factors model
Modern software development is an intricate coordination between people, code and the business. Within this space, CodeScene has identified 4 factors essential to successful software development:
Healthy Code that’s easy to evolve as business needs change,
strong Knowledge Distribution where the team has a high familiarity with the code,
the Team/Code Alignment matches the way the system grows, which leads to
an efficient Delivery with short time-to-market and mature product experience.
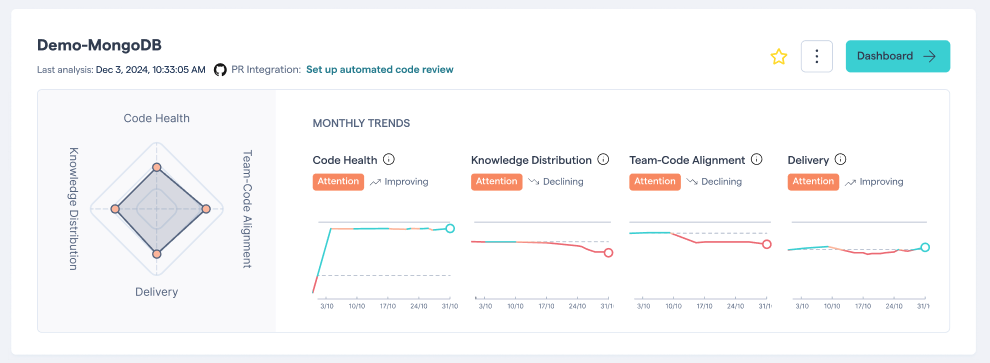
Fig. 11 CodeScene’s main dashboard offers a high-level overview of the current status with key trends for your complete product portfolio.
These for 4 factors represent the intersection of code and people. The main dashboard presents the status of all your CodeScene projects. Click on them to view details and recommendations on the dedicated interactive project dashboard.
CodeScene also offers a software portfolio view, giving you a complete overview of all your projects.
Interactive dashboards with actionable recommendations and feedback
The 4 factors are visualized together with actionable recommendations and feedback as part of the team’s existing workflows. That way, both technical and non-technical stakeholders know the risks as well as where you are heading.
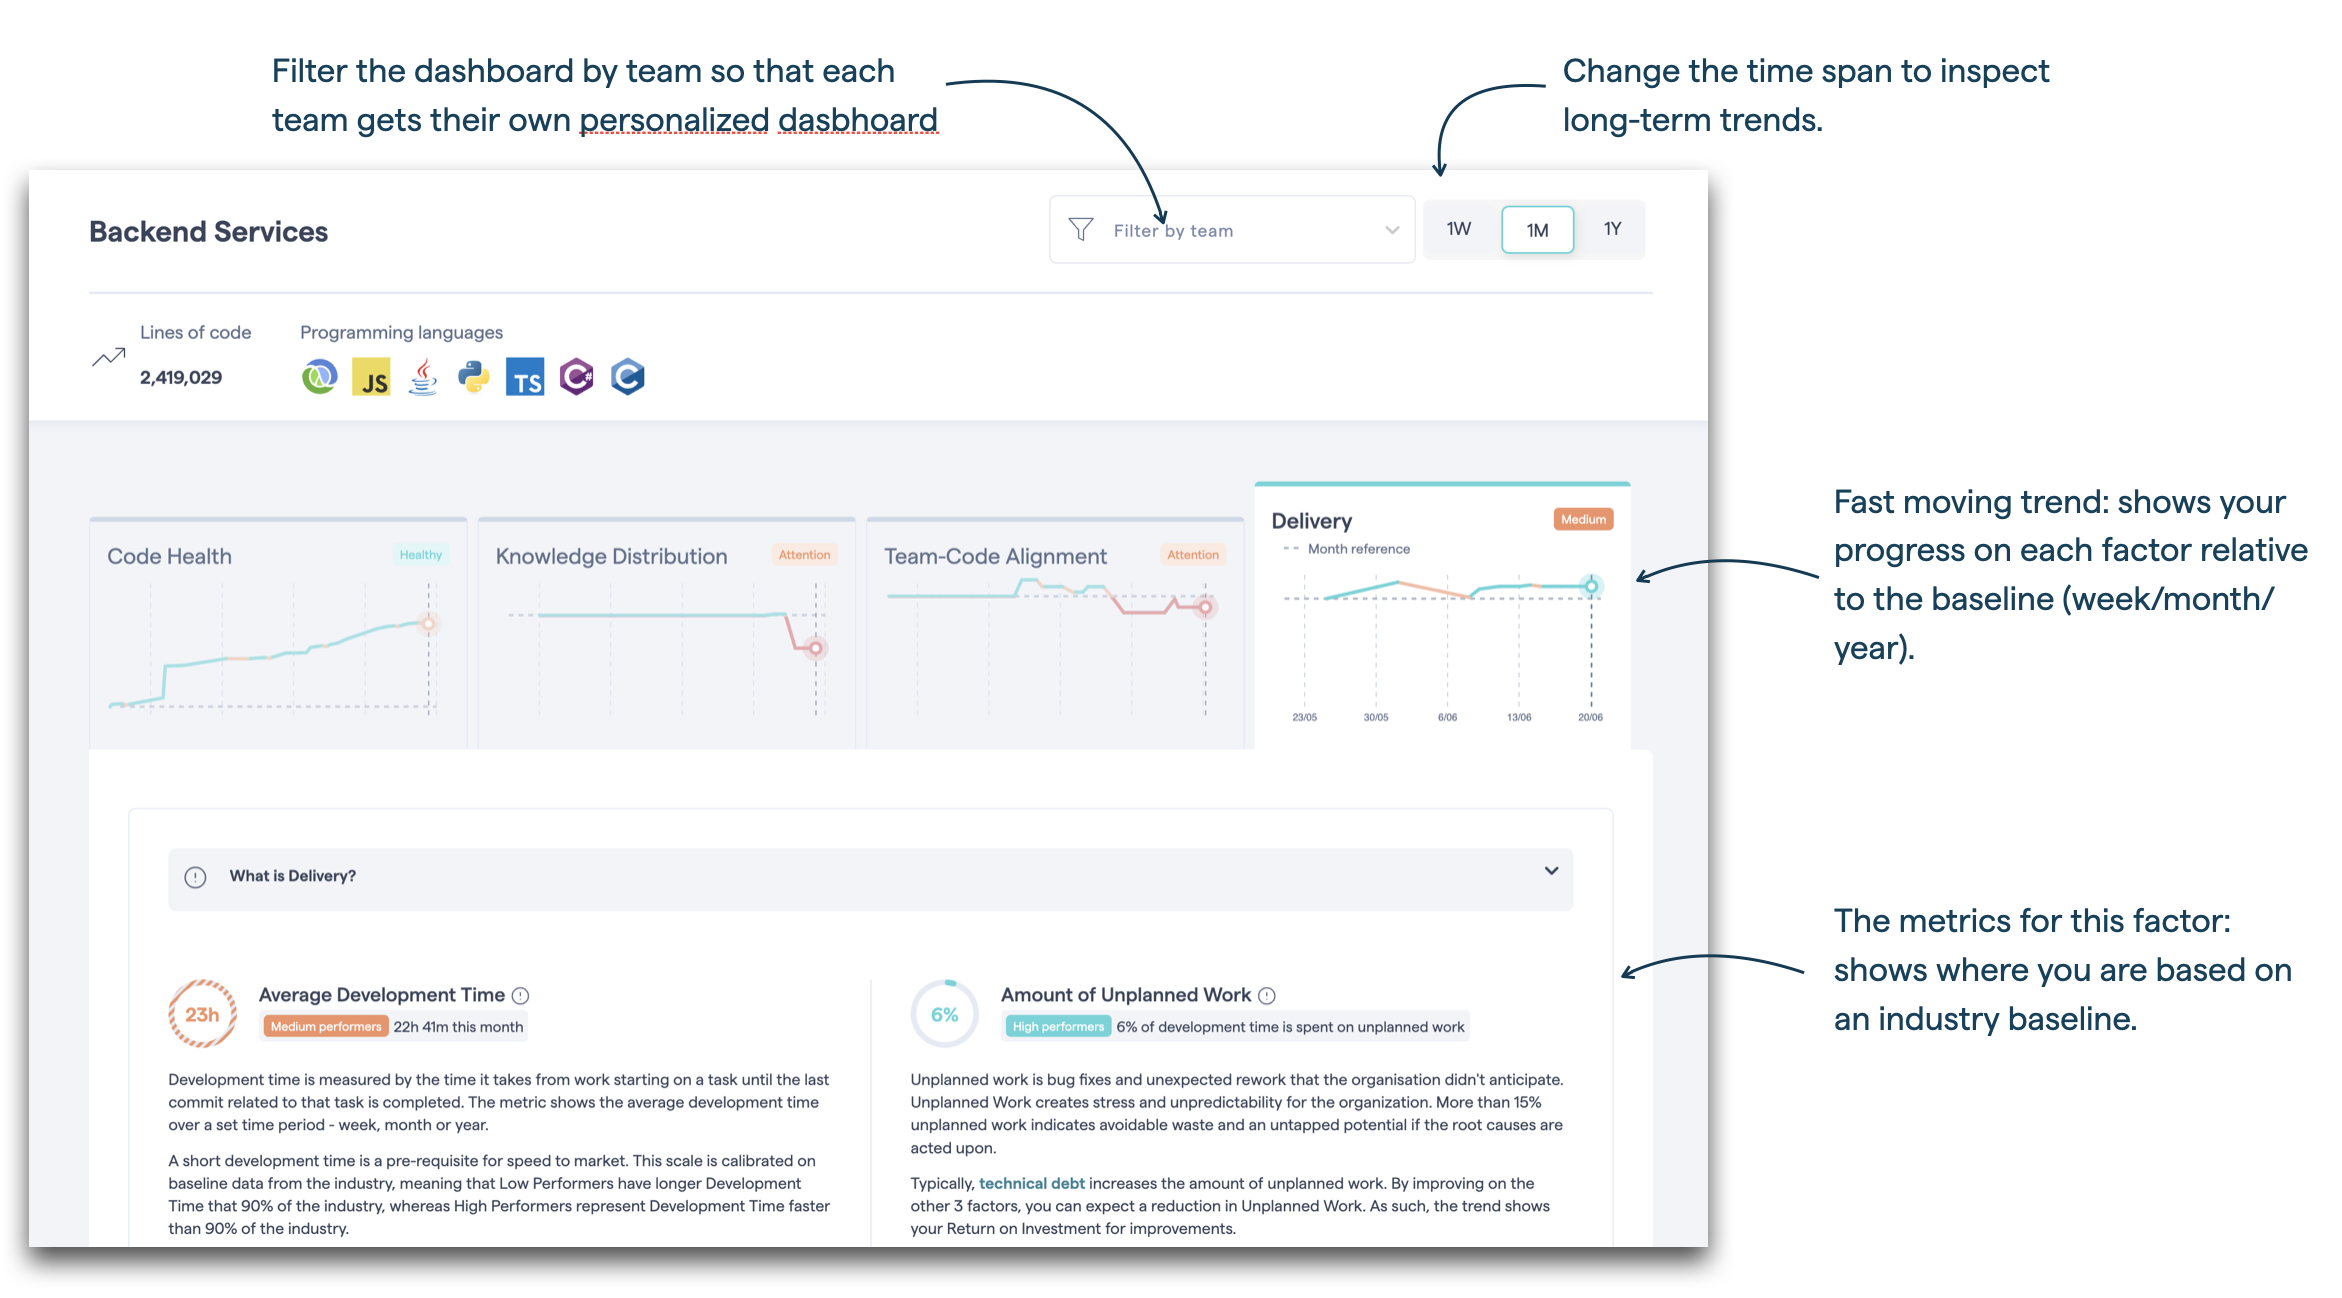
Fig. 12 CodeScene works like a fitness app for software development: identify improvement areas, visualize progress, and get real-time recommendations.
We also acknowledge that trends are more important than absolute values: no matter where you start from, you never want your code or development to get worse. Hence, each factor comes with a fast-moving trend:
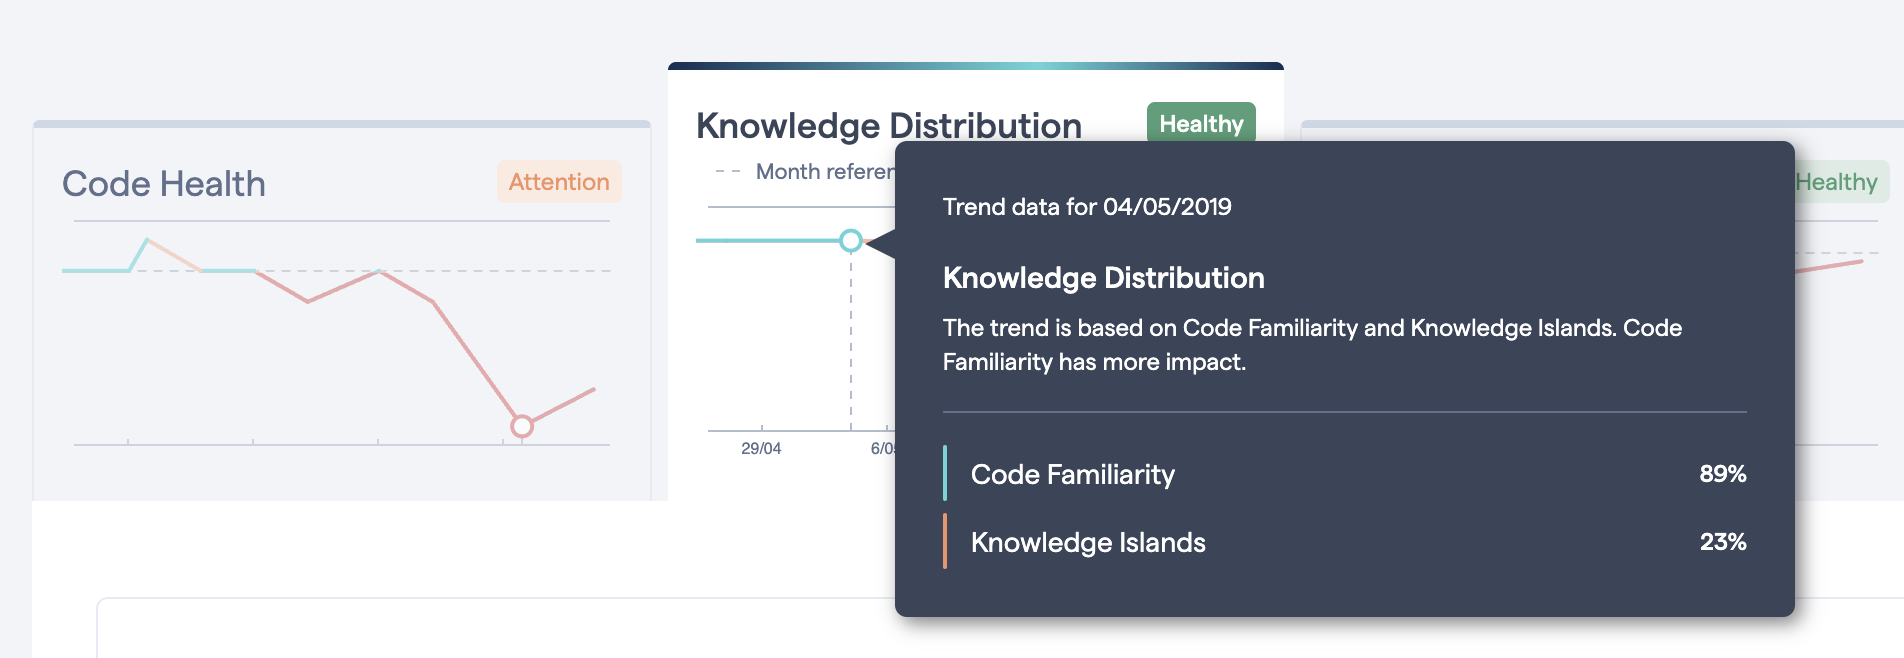
Fig. 13 The fast-moving trends offer continuous feedback on improvements and degradations.
This combination of high-level metrics, interactive analysis views, and fast-moving trends enables continuous feedback, be it for refactorings, organizational change, process improvements, or any other actions.
Warning, risks, and improvements: Each factor comes with feedback on risks and alerts, but also positive reinforcements such as successful refactorings:
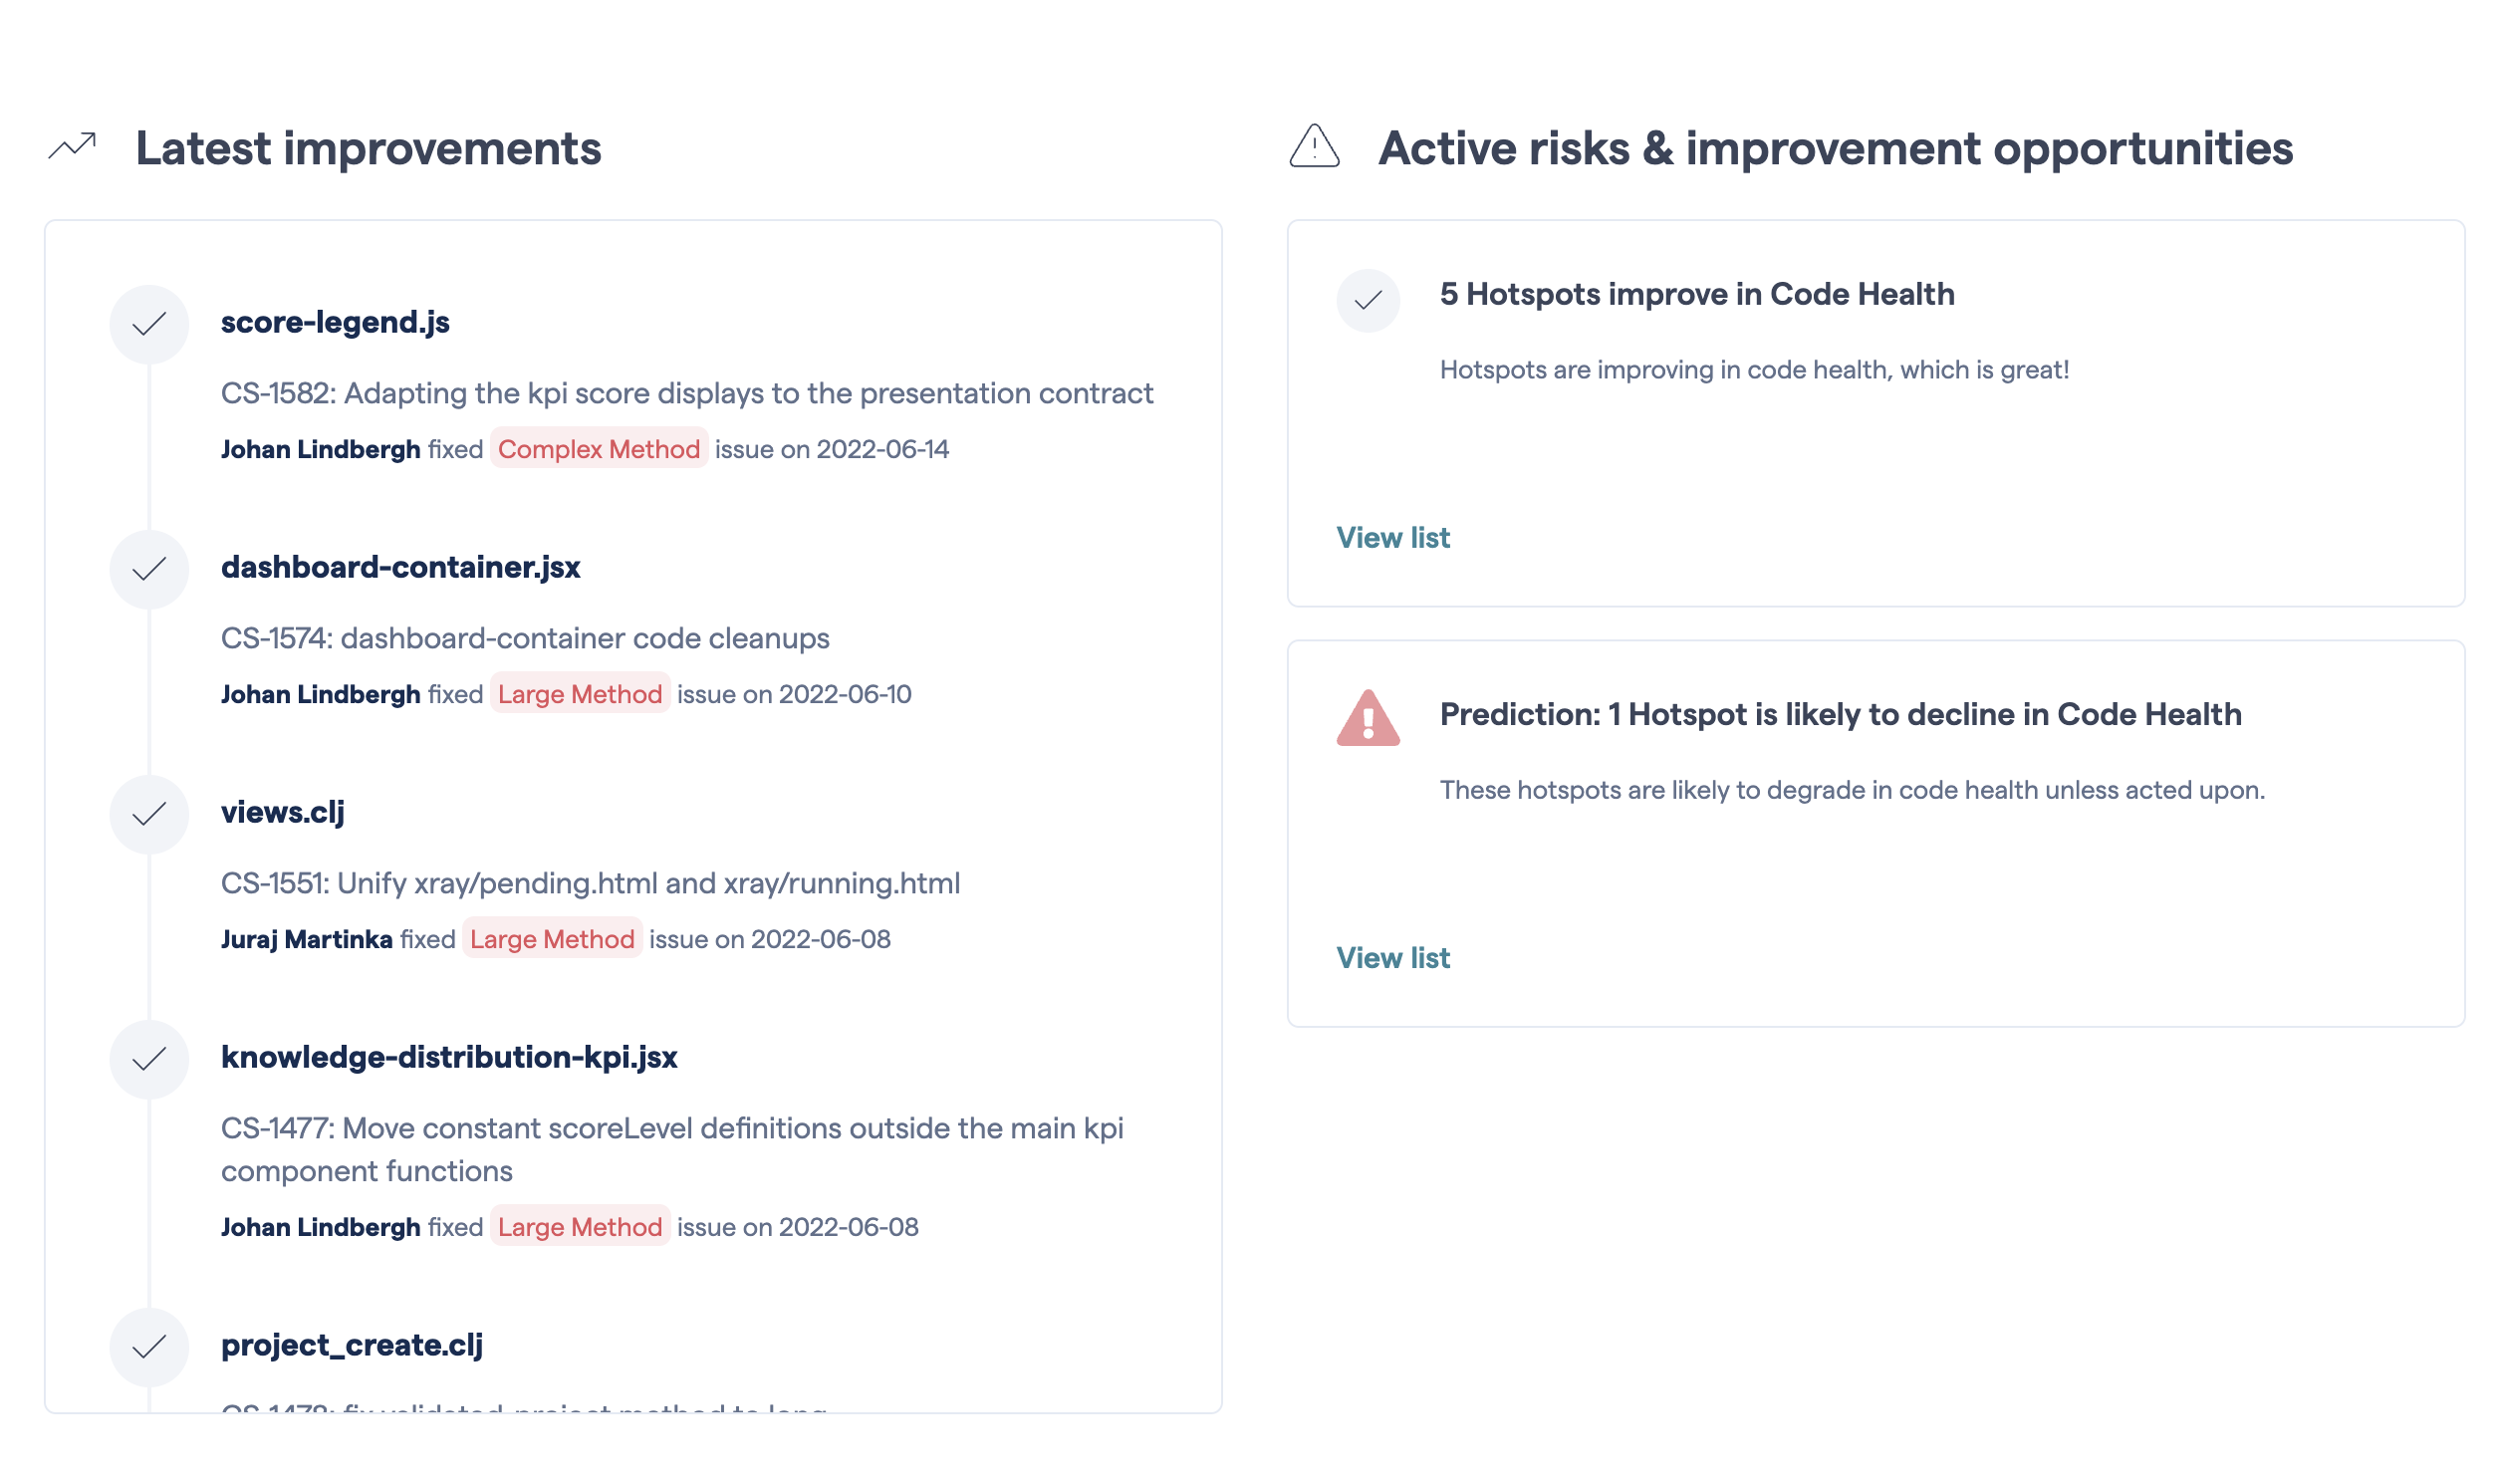
Fig. 14 Notifications on risks together with highlights of successful improvements.
Dig deeper with dedicated focus areas: Each factor offers a set of focus areas where you explore the analysis in more detail using the interactive views:
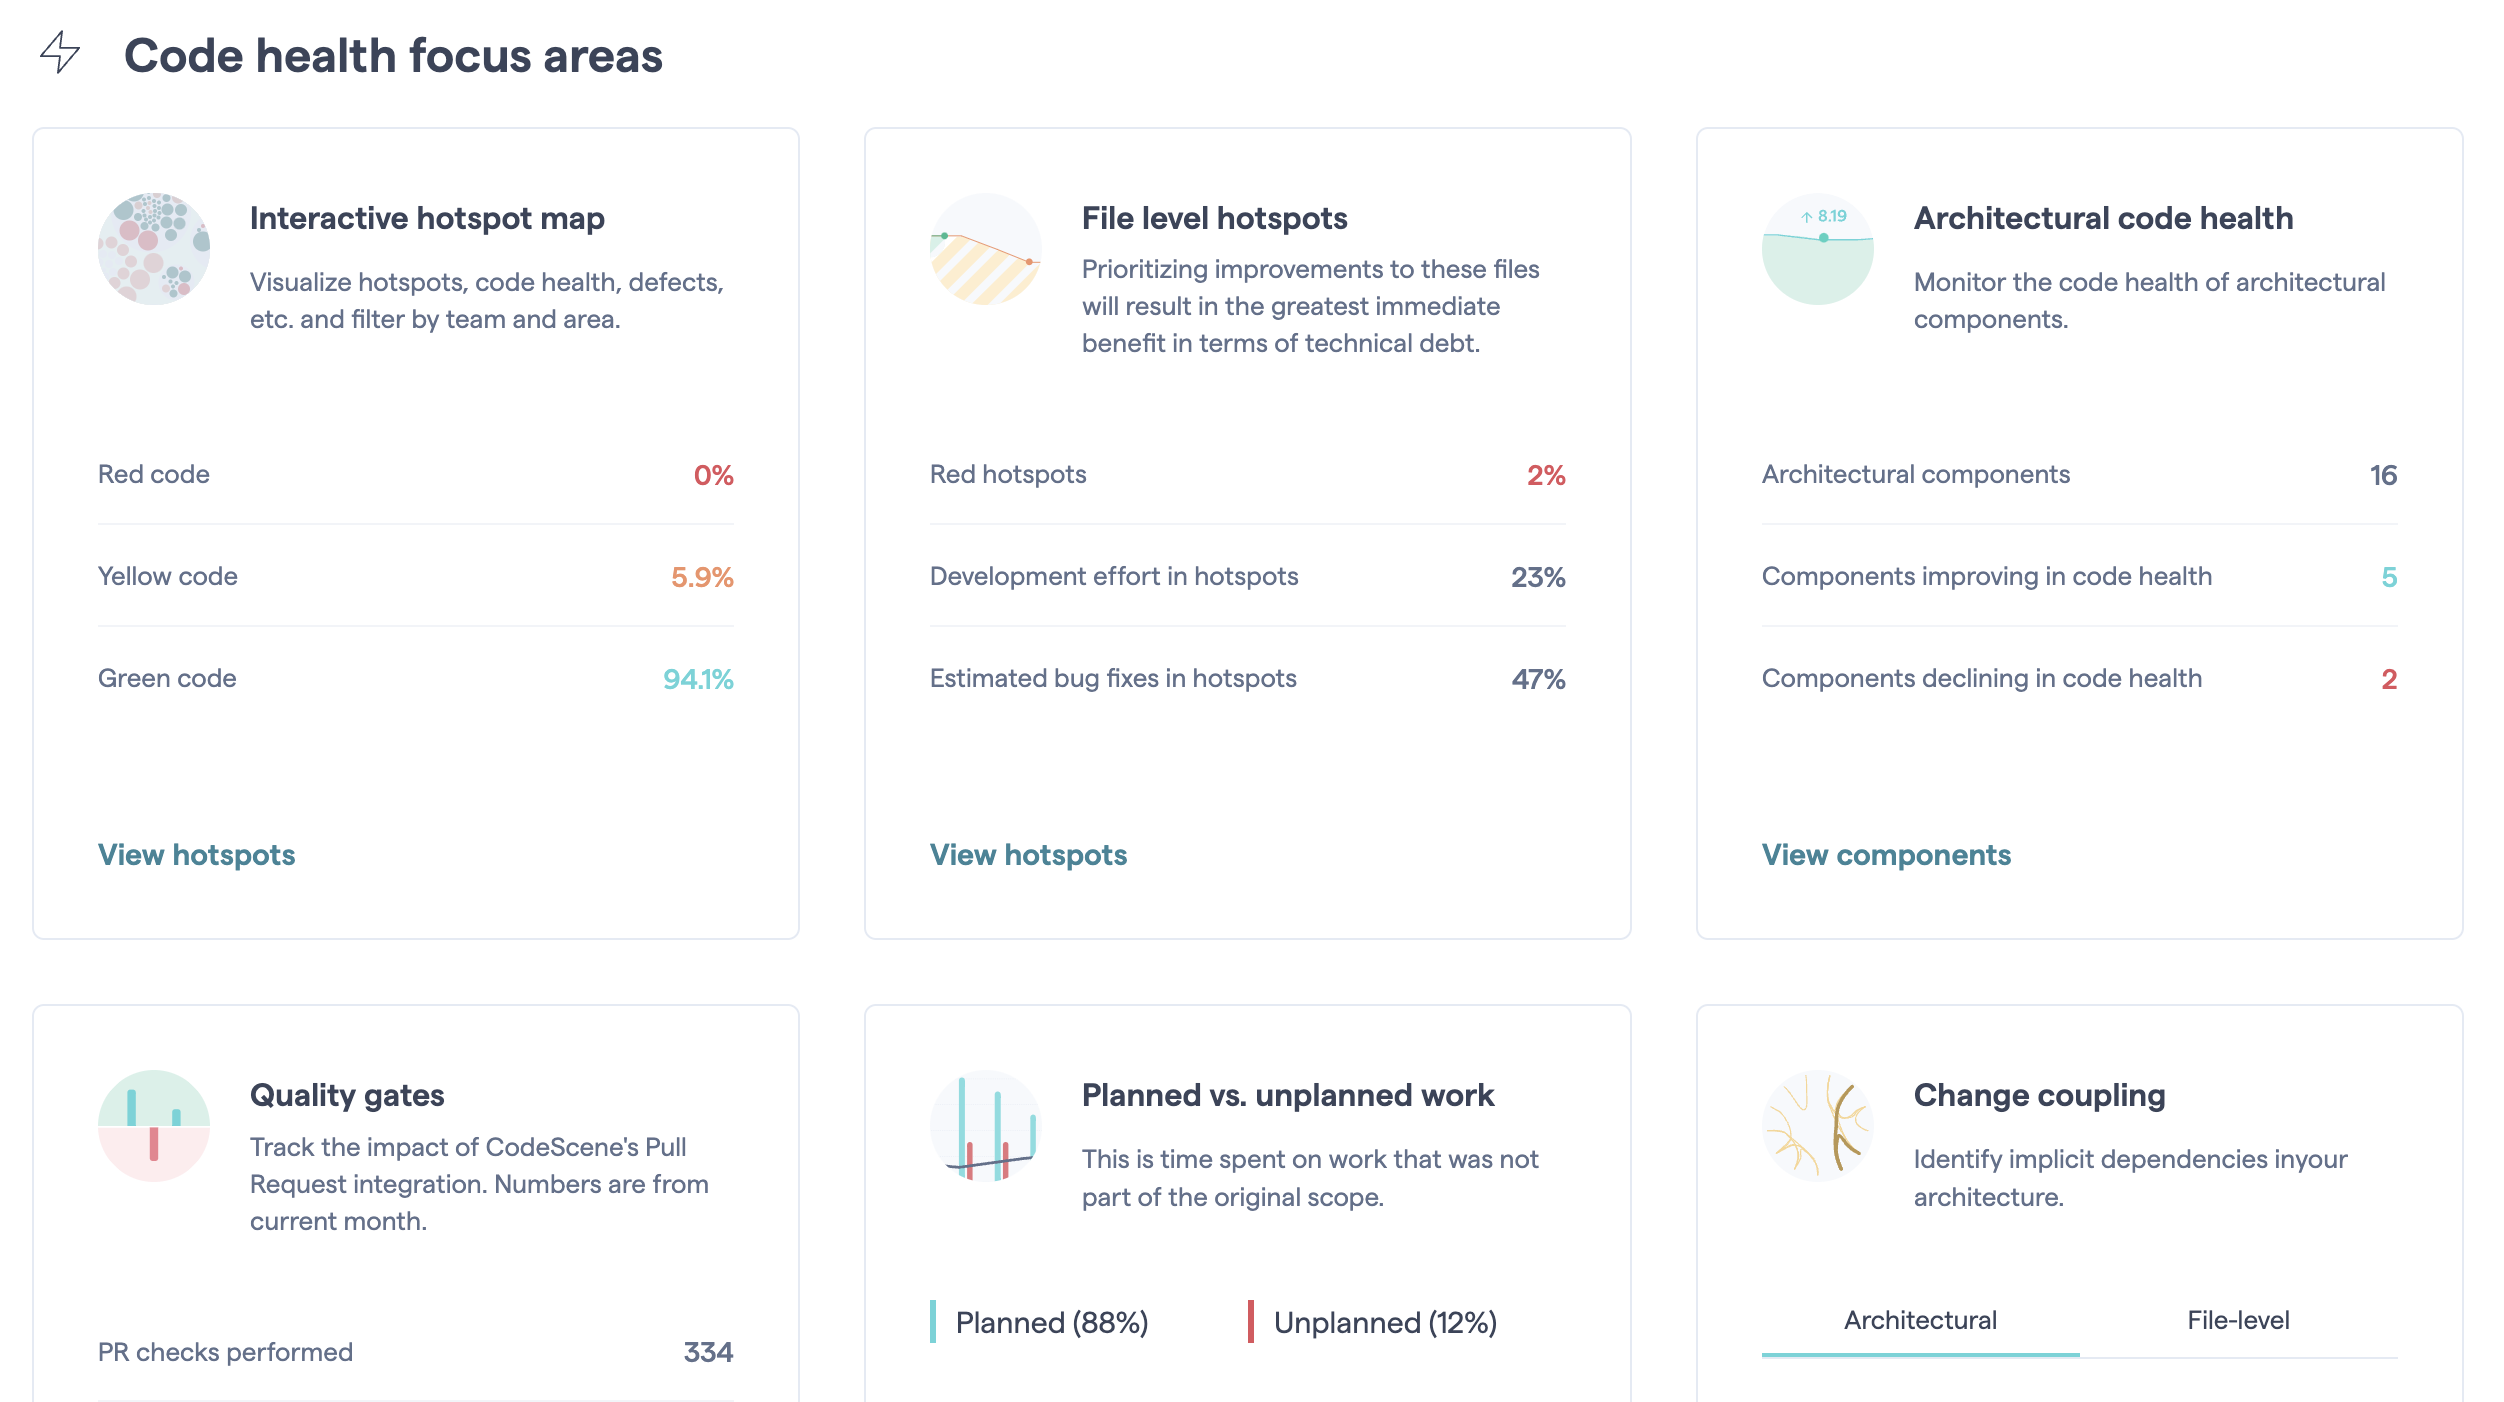
Fig. 15 The focus areas let you explore the analysis in detail.
Personalized dashboards: The CodeScene dashboards are interactive and allow you to:
Filter by development team: By default, CodeScene presents the overall metrics for the whole codebase. To act upon them, filter by team so that each team gets their own personalized dashboard.
Switch time span for trends and metrics: CodeScene lets you toggle the time span to inspect how a particular factor – e.g. code health, knowledge, or delivery – has evolved over time relative to the baseline.
Why 4 factors?
The 4 factors are inter-dependent where the first three are directly influenced by technical and organization decisions, and the last one (Delivery) is an output metric.
Healthy code is the foundation for all factors. However, an unmitigated weakness in another area puts the project at risk. As an example, consider a codebase with healthy code. If the original team is off-boarded and replaced with a new team, then that will impact the delivery efficiency. Time has to be allocated for on-boarding and learning.
On a similar note, we can do well on the code health factors and have a good knowledge distribution, but if the way we are organized into separate development teams is at odds with the software architecture, then the resulting coordination overhead will impede the overall progress.
Software development is multi-facetted, and the 4 factors give you a hoistic overview of the essentials.
What separates CodeScene from other tools on the market?
CodeScene differs from static analyis tools like SonarQube, CAST, and Code Climate in three important ways:
we include people factors like code familiarity and knowledge distribution,
we prioritize all findings based on how you – as an organization – works with the code, and
we base our alerts and quality gates on trends rather than absolute values.
This is impoartant since technical debt cannot be prioritized from code alone. CodeScene’s appoach makes sure that our recommendations are both actionable and relevant from a business perspective. This is possible by combining code analysis with data from Git and project management tools like Jira.
CodeScene also differs from engineerng efficiency tools like Pluralsight Flow, Velocity, Swarmia, etc. by having a deep understanding of the source code. This makes our data actionable in that we can link inefficiencies to specific areas of the code, and also prioritise organizational risks – like key personnel dependencies – based on the quality of the impacted parts of the code.
Finally, but nonetheless critical, CodeScene has the only validated code health metric; CodeScene’s code health measure is known – from large-scale research – to correlate with shorter development times and fewer defects.
How CodeScene’s metrics complement Accelerate
CodeScene’s 4 factors focus on the development side of software. As such, our factors complement the work by DORA and Accelerate:
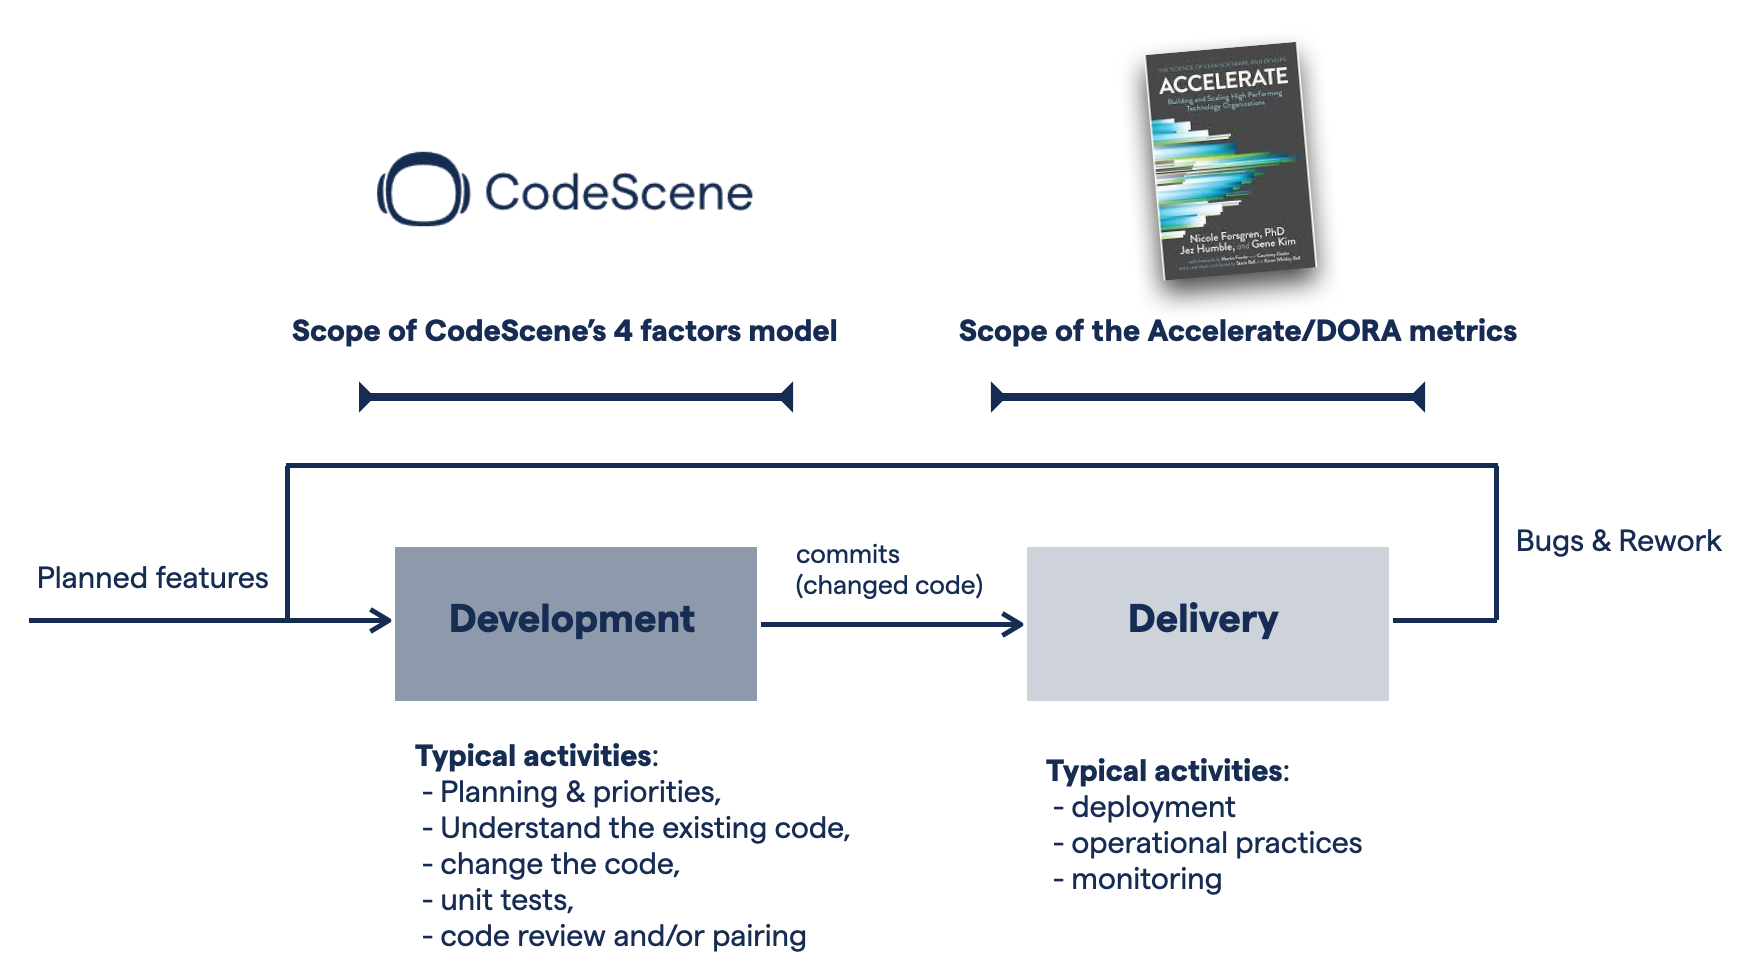
Fig. 16 CodeScene’s 4 factors visualizes the development side of software.
Exploring the 4 factors
This document walks you through the core of the 4 factors model. All details on how the factors are measured and the scales used for baselining are included in the UI itself.
Code Health: measure technical risks, waste, and opportunities
Code Health is an aggregated metric based on 25+ factors scanned from the source code. The code health factor correlates with increased maintenance costs and an increased risk for defects. A healthy codebase enables a fast time-to-market with, on average, 124% faster development time. Healthy code also contains 15 times fewer defects than unhealthy code (claims supported by the research from Code Red: The Business Impact of Code Quality ).
The code health KPIs are described in more details in the UI as well as in the Code Health – How easy is your code to maintain and evolve? documentation.
Recommended usage: No matter what code health level you start from, you want to ensure that it doesn’t get worse. In practice this means enabling CodeScene’s automated code review and PR integration (see Integrate Automated Code Health Reviews in Pull Requests and Merge Requests ).
Use code health information as part of each team’s planning and retrospective session. We recommend that each team filters the dashboard for their team and use the resulting data for:
Reality-based task planning: with an accurate map of your project’s code health, communicate effectively with managers and other stakeholders to create realistic expectations. Detect high-risk tasks early.
Making the business case for refactoring: identify improvements in the areas of the code that have work planned. Create a shared understanding between all stakeholders (engineering + product).
Knowledge Distribution: code familiarity and key personnel dependencies
Successful software development largely depends on effective knowledge sharing within the organization. A team loses collective knowledge when a code contributor leaves. Knowledge Distribution measures the current state of Code Familiarity – how much of the code is written by the current team - as well as the risk in terms of Knowledge Islands, which represent potential key personnel risks.
Knowledge distribution is facilitated by knowledge sharing and effective collaboration process. Immediate key personnel exposure is mitigated via high code health in the relevant parts of the code; the impact of knowledge islands can be mitigated via refactorings.
Recommended usage: Knowledge sharing takes time, hence this is a factor that takes longer to improve. Use these analyses pro-actively to make sure that there aren’t any knowledge islands in critical parts of the code. Use the analyses during off-boarding scenarios to make sure any upcoming risks are mitigated (see Mitigate the Bus Factor via the Off-Boarding Simulation).
Team-Code Alignment: enable efficient team coordination by aligning the team structure with the software architecture
Getting the organizational side of software right is just as important as any properties of the code. In general, the modularity of the software design needs to align with the responsibilities of the development teams. That principle is the core of Conway’s law. A successful alignment minimizes coordination and achieves short lead times.
Team-Code Alignment visualizes this relationship by combining measures of Team Coupling and Team Cohesion. The better the team coupling and the more loosely coupled, the less coordination overhead and the fewer merge conflicts.
Recommended usage: The Team-Code Alignment explorer (see Build efficient teams via strong Team/Code alignment) gives transperancy to the overall metrics and lets you identify coordination bottlenecks from the perspective of the teams:
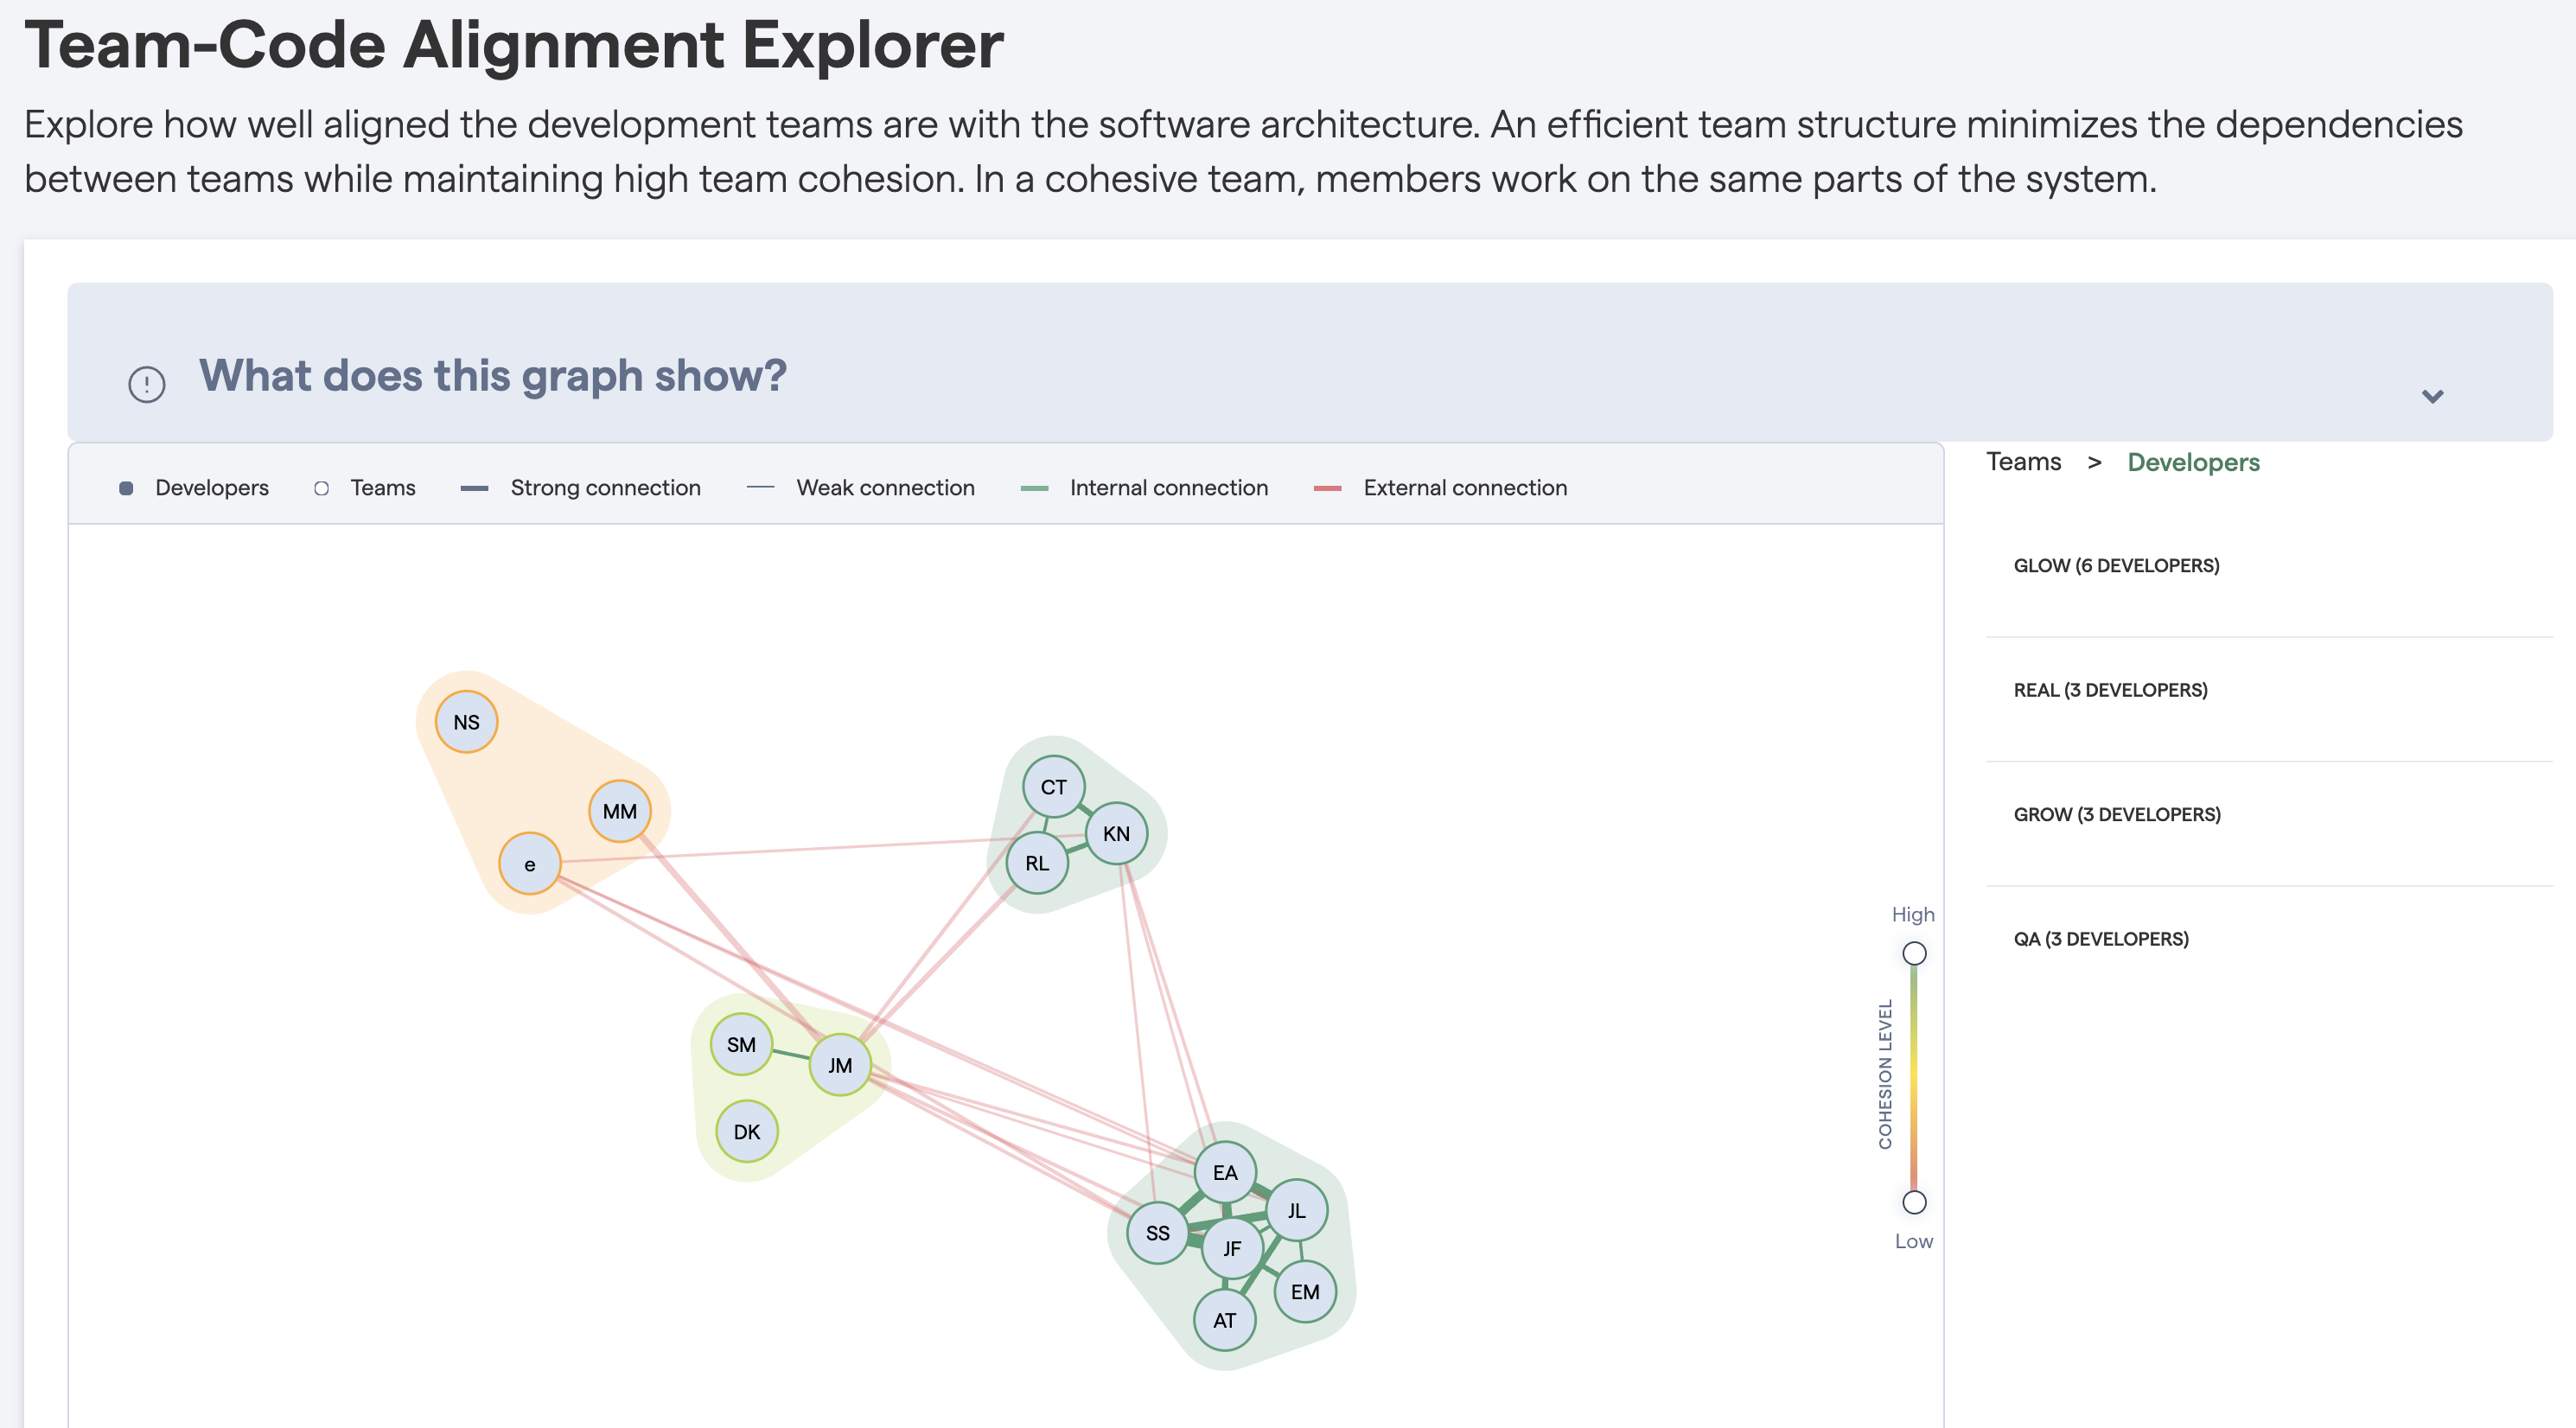
Fig. 17 Visualize dependencies between development teams, and explore how cohesive the teams are.
The Delivery factor: short lead times with a low amount of unplanned work
Delivery is an output metric that captures the efficiency of the overall process. Delivery is influenced by process, but also by how well you do on the other factors; healthy code, strong knowledge growth, and team/code alignment are all pre-requisites for efficient delivery.
CodeScene’s Delivery metrics focus on the process of writing code; we measure the efficiency of the development, not the deployment side. This complements the Accelerate metrics which focus on the deployment and DevOps efficiency. Efficient software development is strong on both dimensions.
Recommended usage: The Code Red paper identifies a strong correlation between healthy code and efficient development. Use the Delivery metrics to ensure that any improvements – code, people, or process – come with a corresponding improvement in shorter development times and less unplanned work.
Use the team-specific views so that each team can get their own personalized delivery feedback:
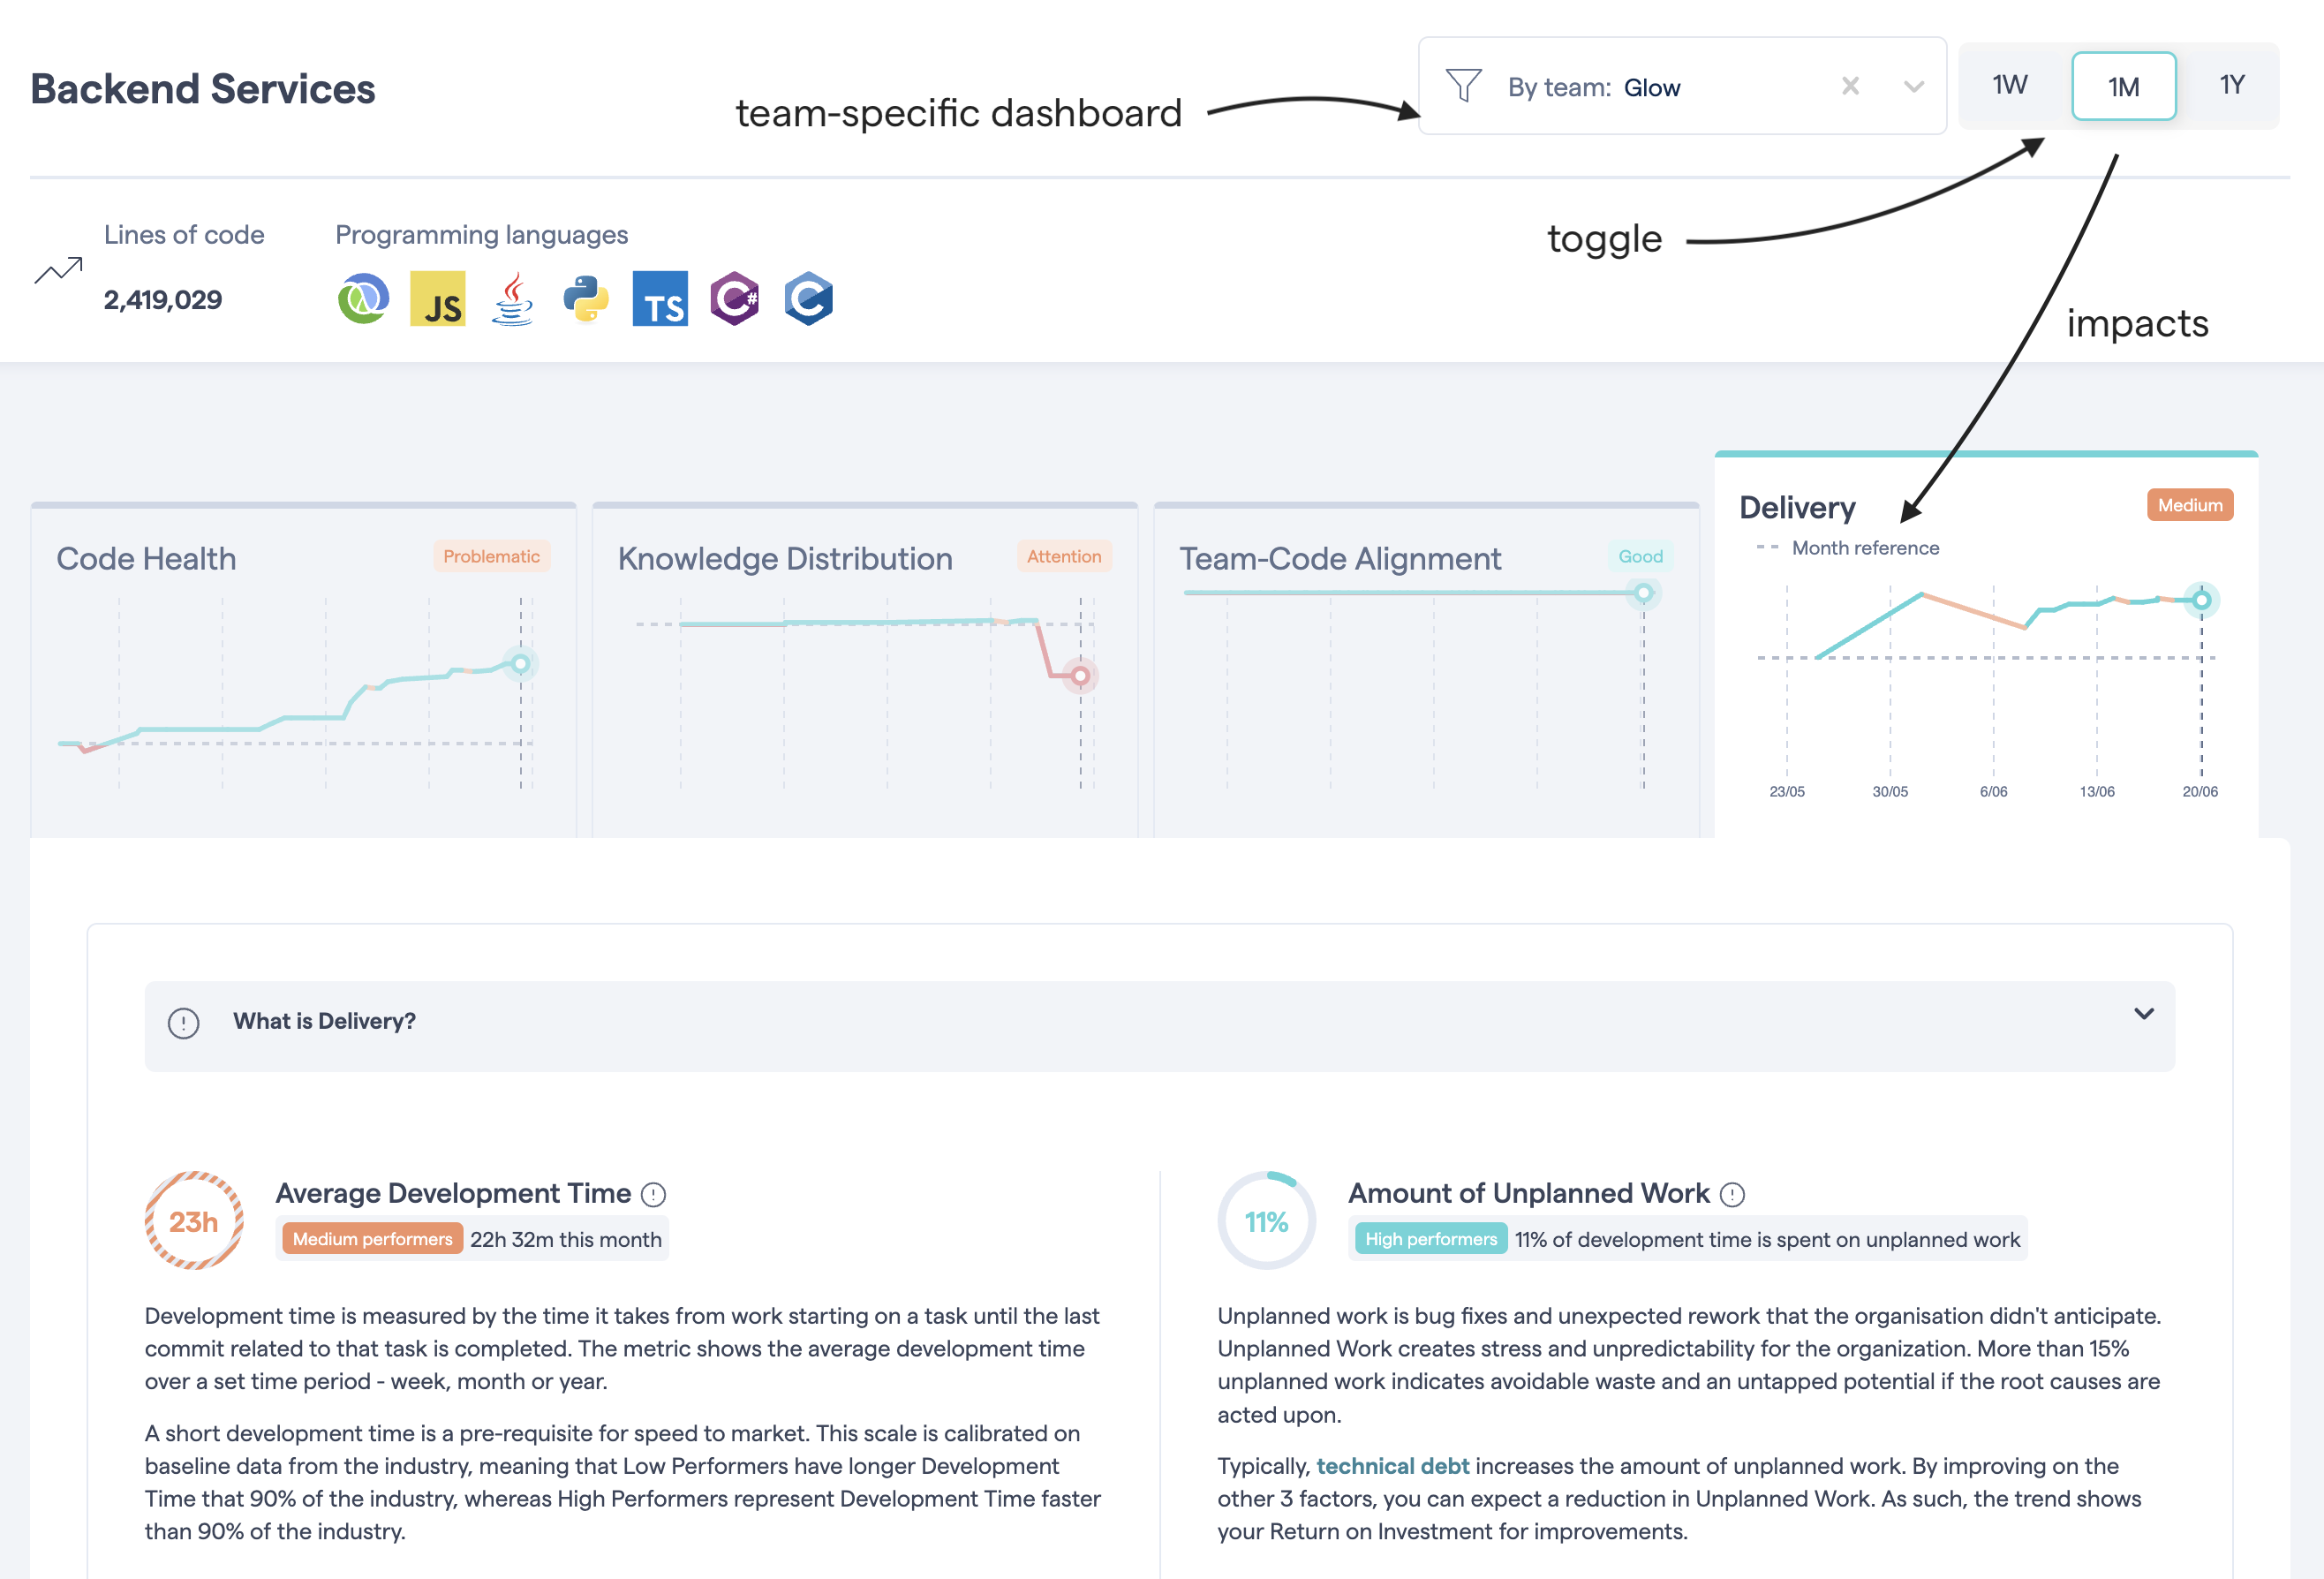
Fig. 18 Let each team get their personalized Delivery feedback – perfect for retrospectives.
Software portfolio: a multi-project overview
The Software Portfolio gives a high-level overview of all your projects in terms of CodeScene’s four factors and Code Coverage. It is designed to make it easy to see trends impacting your entire organization and to make high-level prioritizations.
The Software Portfolio can make it easier to spot correlations between Code Health and the other factors.
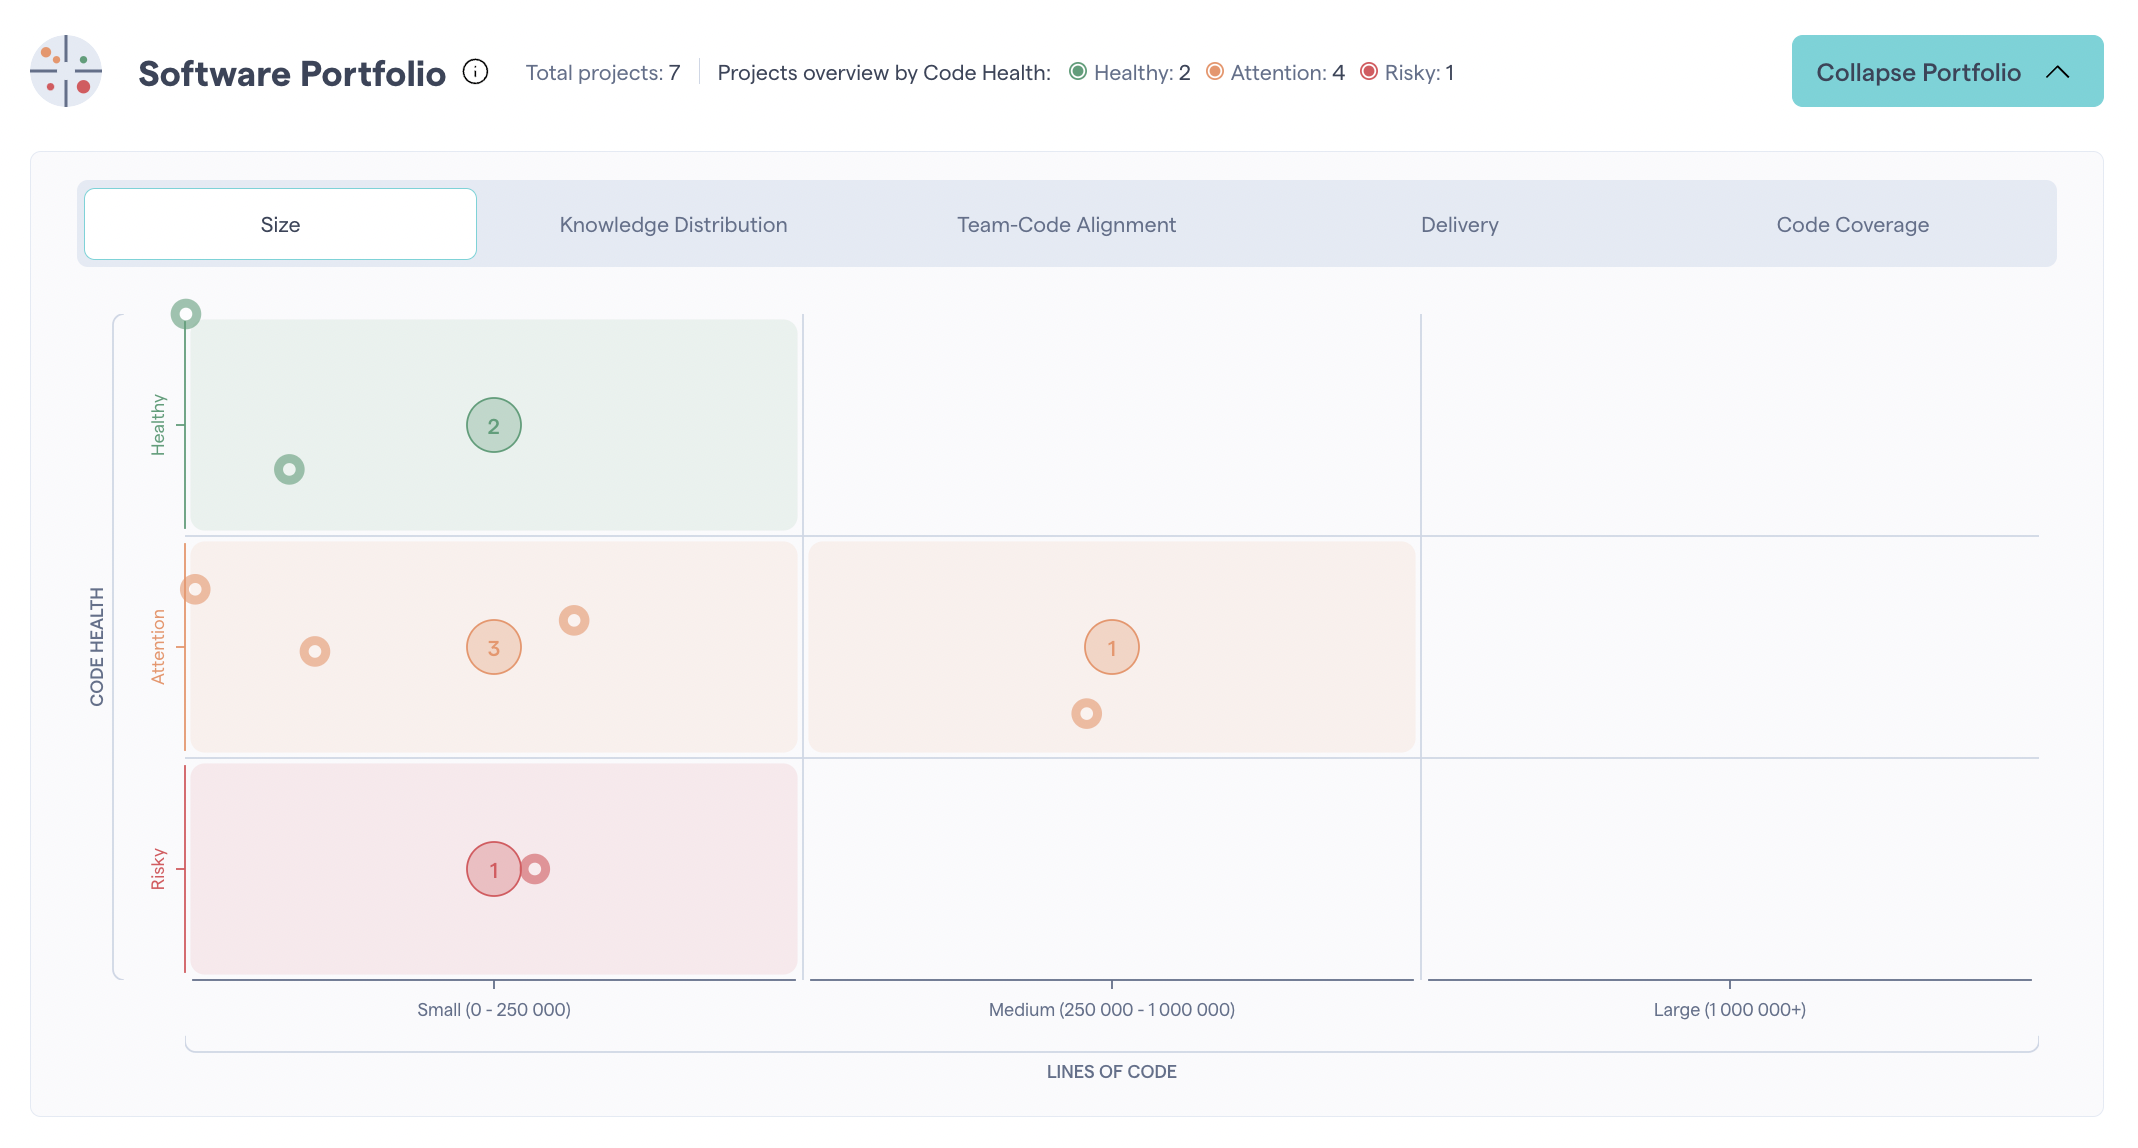
Fig. 19 The software portfolio gives an overview of the attention areas for all projects.
Clicking a part of the graph shows a list of the projects contained in that section. This makes it possible to hover over the markers in the graph to see what project they correspond to. Conversely, hovering in the list highlights each marker in the graph.
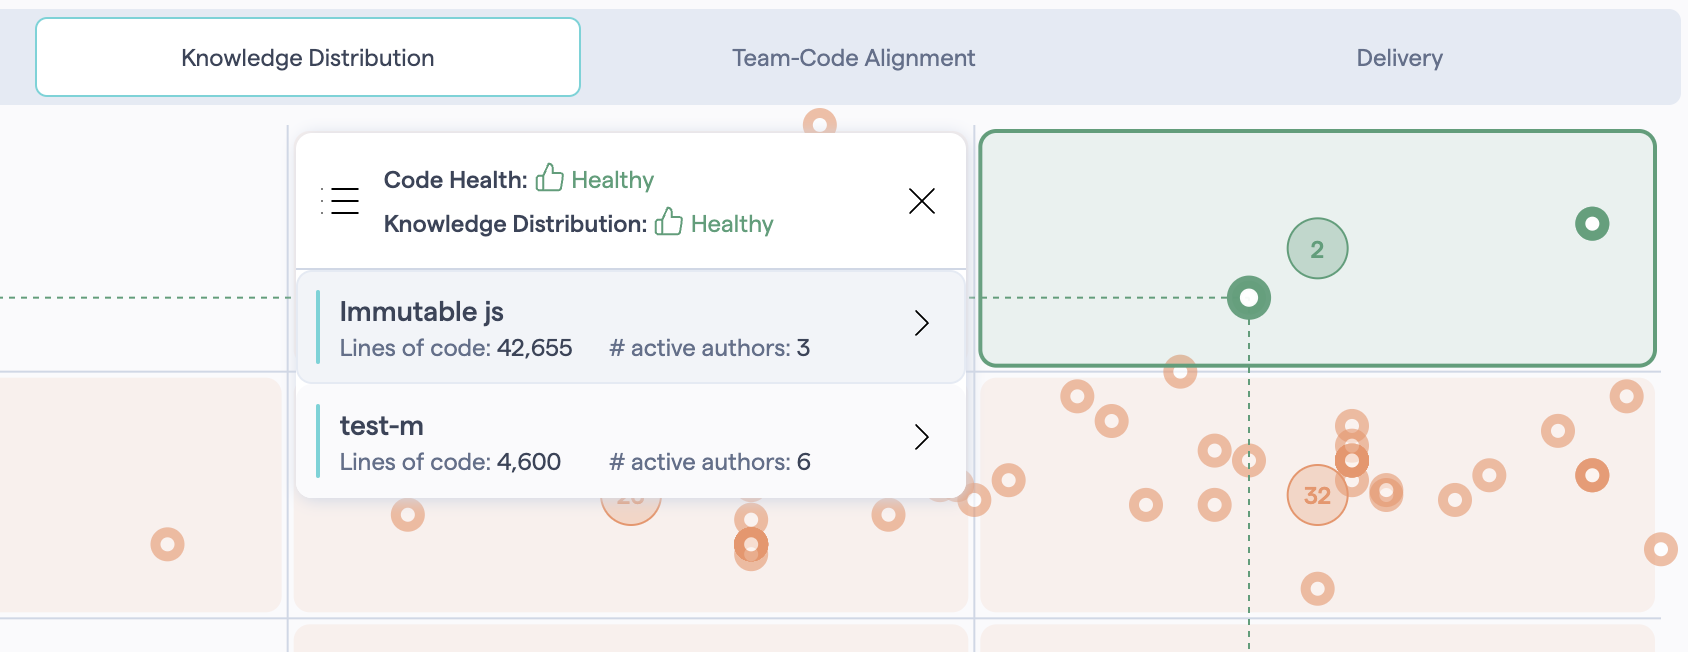
Fig. 20 Clicking an area shows a detailed view of the projects in that sector
Project listing: sort and filter controls
The sort and filter controls let you quickly find projects that need attention. Once selected CodeScene will remember your filter choices and sort preferences between sessions.
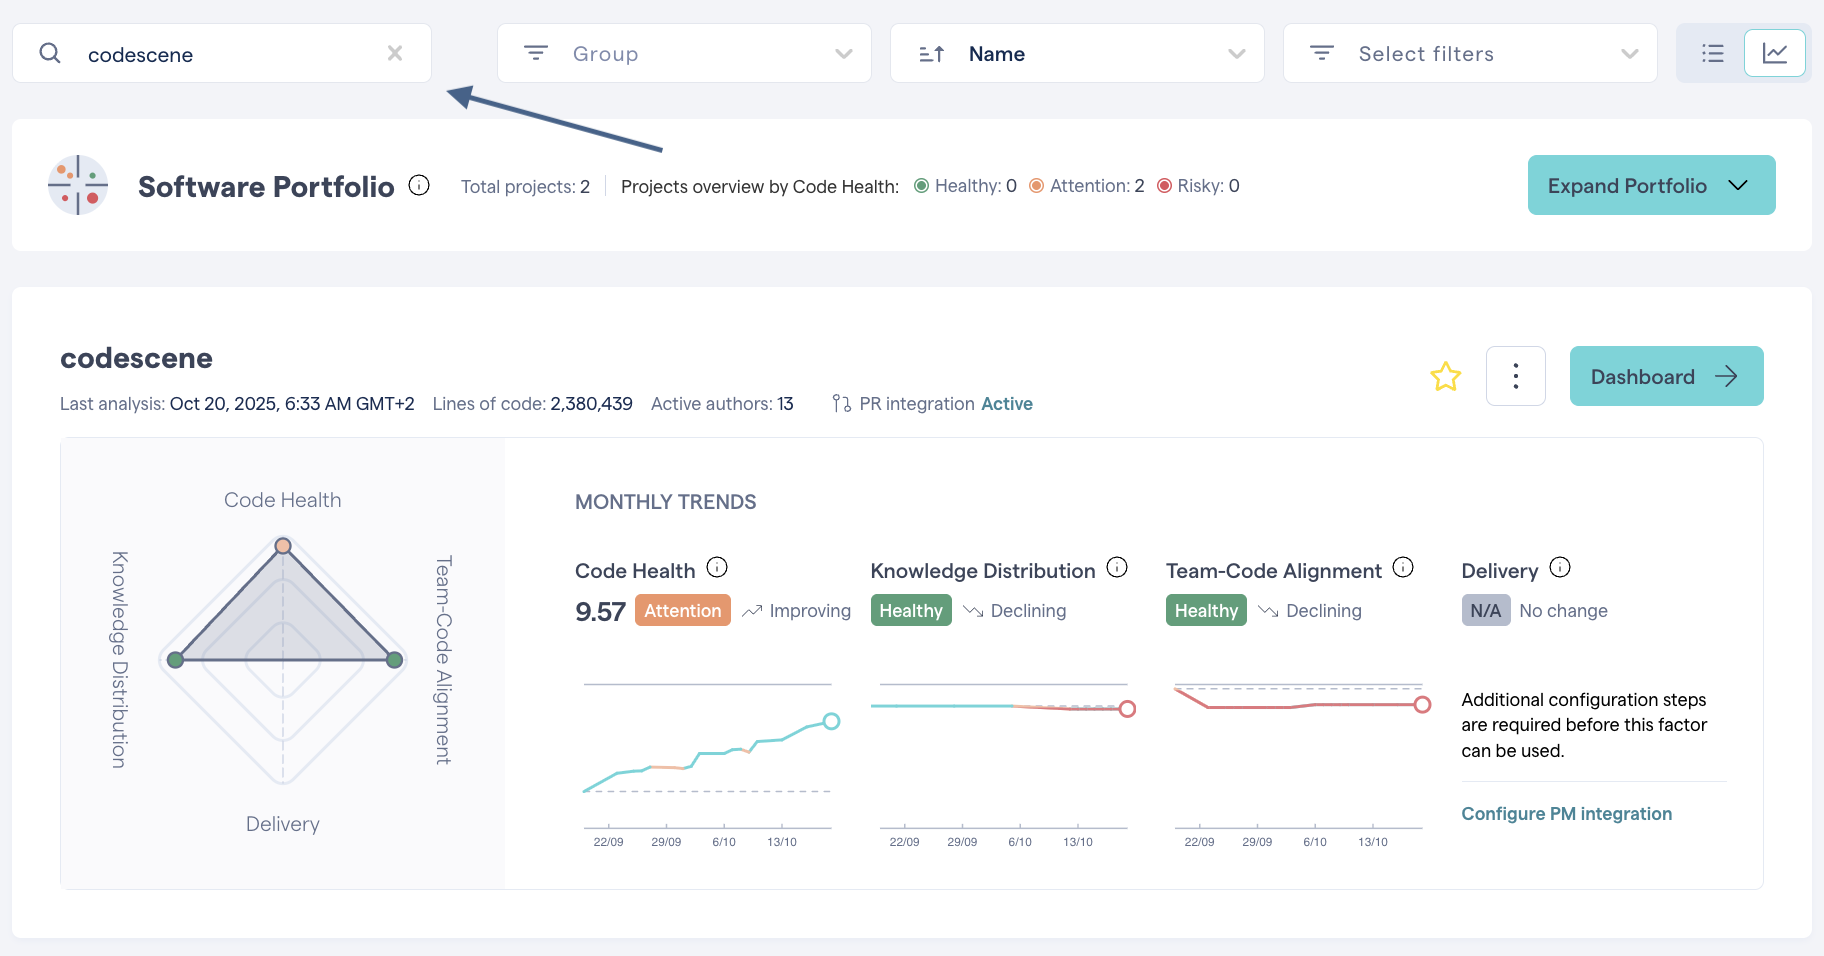
Fig. 21 Use the search filter to filter projects by name.
Apply the group filter (available on On-prem only) to filter only projects that belong to specific group:
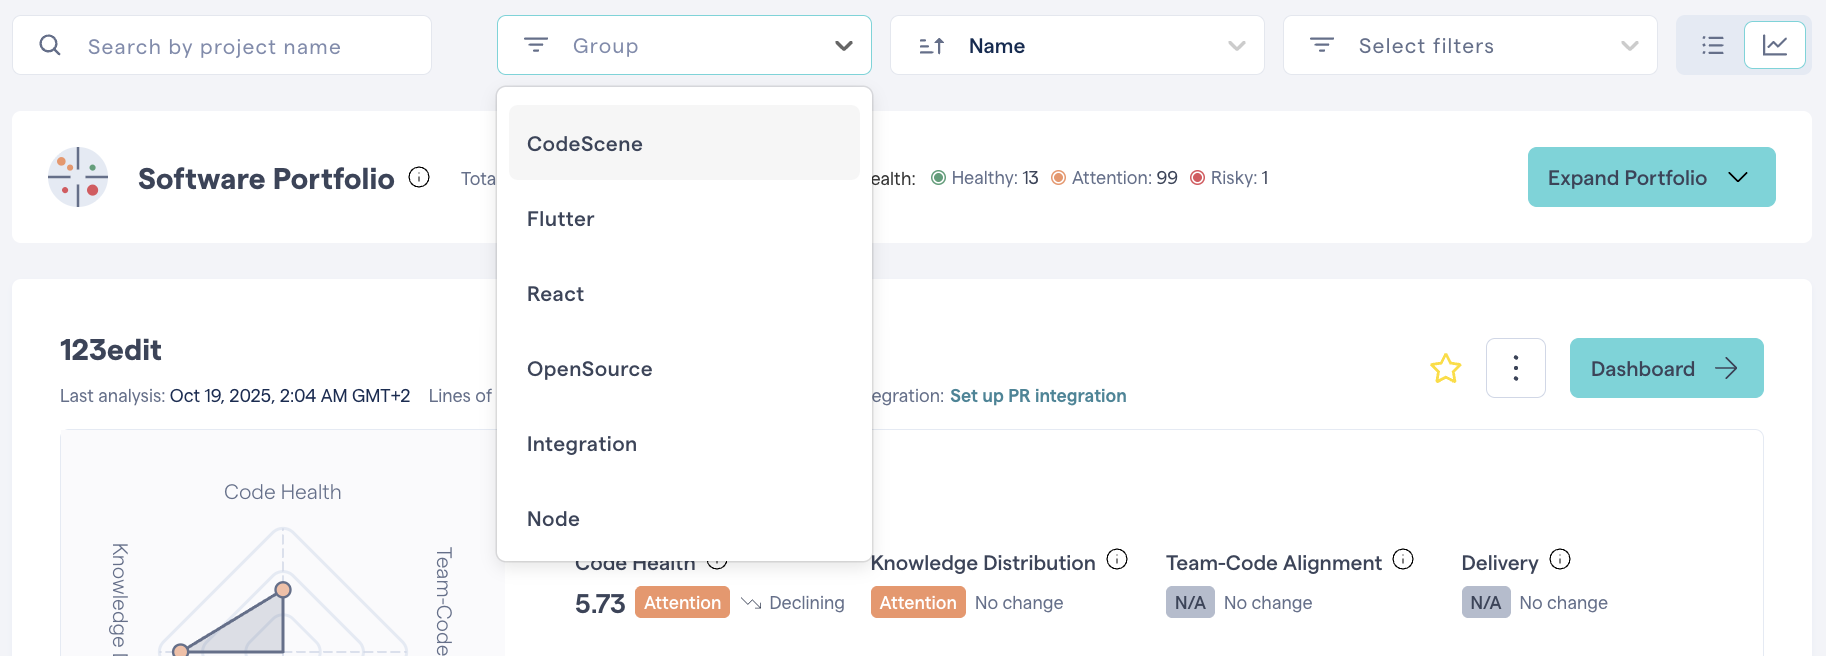
Fig. 22 Use the group filter to filter projects by group.
Sort projects by name, code health average score, active authors, lines of code, favorites, analysis date, or by projects with the errors:
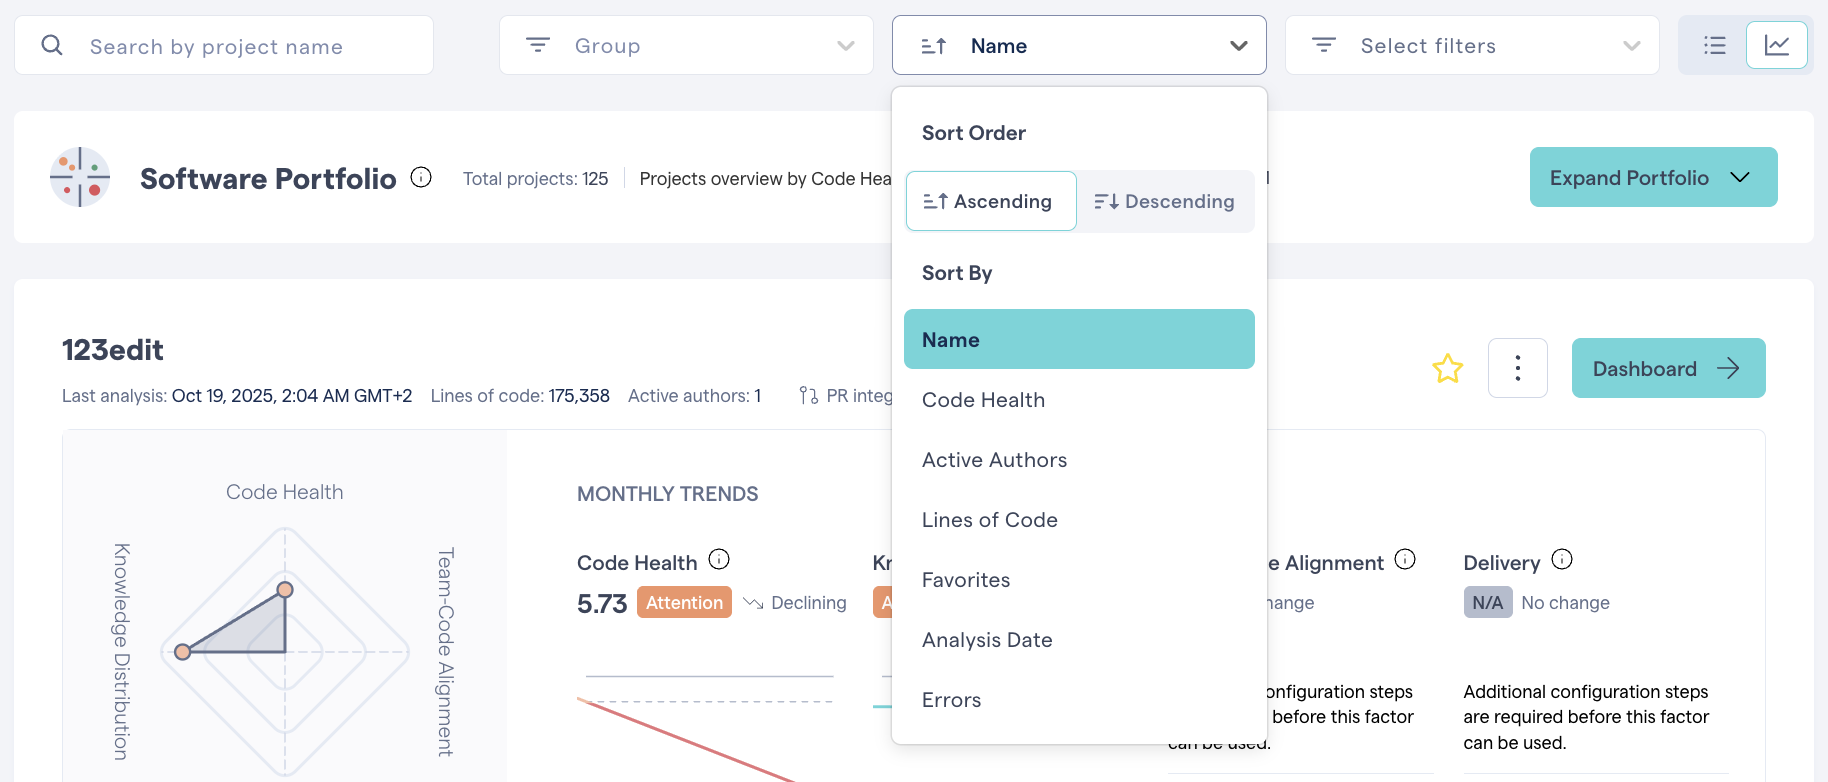
Fig. 23 Sort projects by various criteria.
Combine slider-based filters to focus on ranges of code health average score, lines of code, active authors.
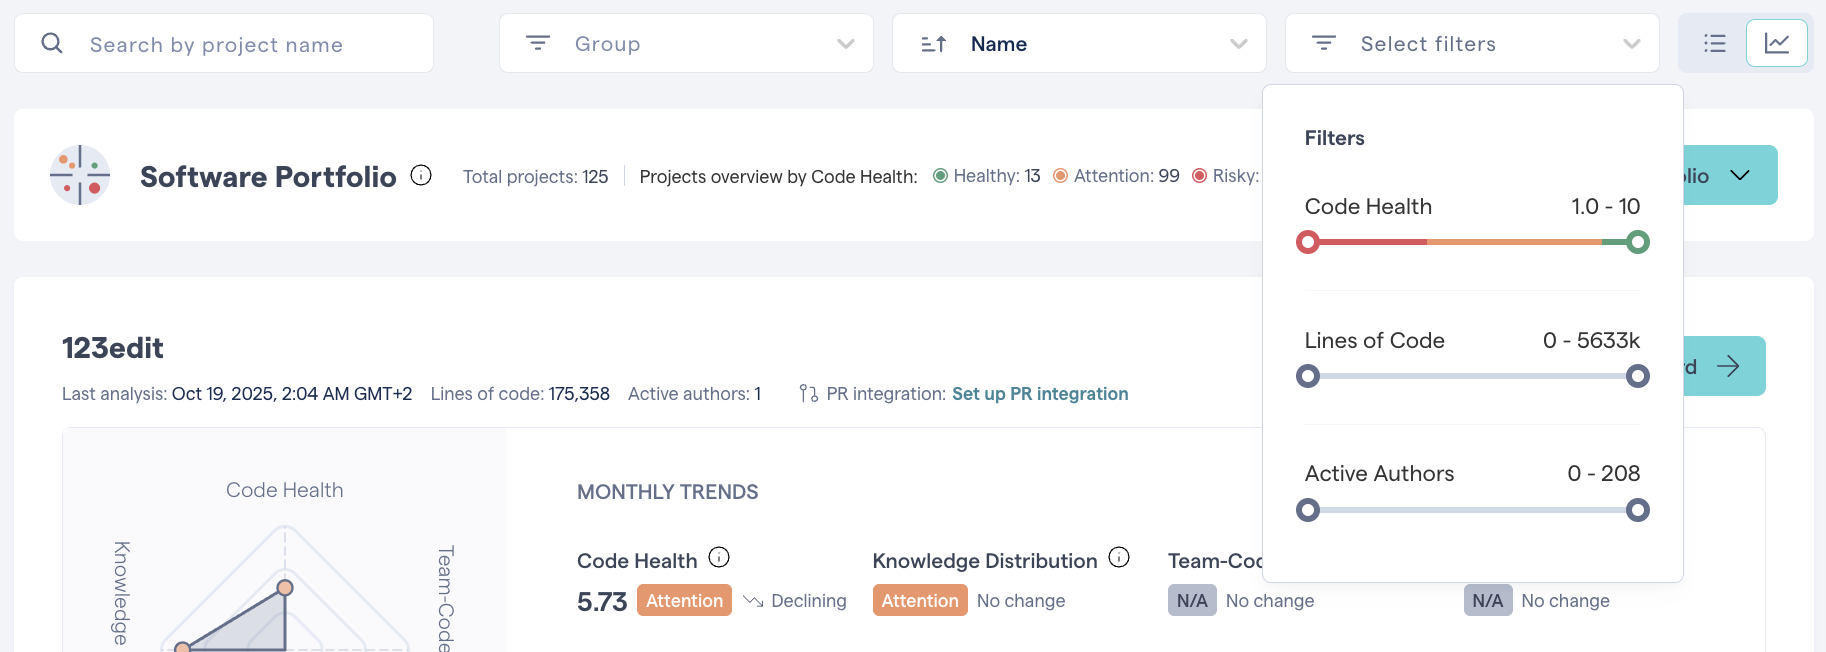
Fig. 24 Use range-based filters to focus on specific ranges.
Whenever there are failing projects, a banner appears above the filters with shortcuts to highlight failing projects:

Fig. 25 Click ‘Show failing projects’ to filter the list to only show failing projects.